| |
Presidential
Candidate | Vice Presidential
Candidate | Political
Party | Popular Vote | Electoral Vote |
 | Richard Nixon | Spiro Agnew | Republican |
676,446 |
63.37% | 9 |
 | George McGovern | R. Sargent Shriver | Democrat |
371,159 |
34.77% | 0 |
 | John Schmitz | Thomas Anderson | American |
17,627 |
1.65% | 0 |
| Other (+) | - | - |
2,267 |
0.21% | 0 |
 |
Map Key
| > 40% |
 |
 |
| > 50% |
 |
 |
| > 60% |
 |
 |
| > 70% |
 |
 |
| > 80% |
|
 |
| > 90% |
|
 |
| Turnout
 |  |  |
|
| Maps | 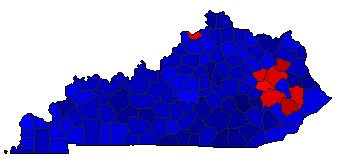 |  | | Pop. (m) | | Rep. (m) | | Dem. (m) | | Swg (m) | | Tnd (m) |
| |
| Demographic Data
| 1980 Population: | 3,660,324 | Enum. | 1980 Population Density: | 35.6 | persons/km2 | | 1972 Population: | 3,336,106 | Est. | 1972 Population Density: | 32.4 | persons/km2 | | 1970 Population: | 3,220,711 | Enum. | 1970 Population Density: | 31.3 | persons/km2 | | Total Electoral Vote: | 9 | | Electoral Vote Density: | 370,678 | persons/EV | | Land Area (2000): | 102,896 | km2 | Annual Pop Growth Rate: | 1.3 | % |
| Election Data and Statistics:
| Election Tools
- Atlas Forum Image Code for Maps: County, Pop, Tnd, Swg
Data Sources:
- Source for Popular Vote data: Kentucky Secretary of State, Statement of the Official Vote of Kentucky General Election Held Tuesday, November 7, 1972 (Frankfurt, 1972)
- Source for Population data: U.S. Census Bureau.
| Results for and Individual County:
|
|
| |


