Home
2024
Election Results
Election Info
Weblog
Forum
Wiki
Search
Email
Login
Site Info
Store
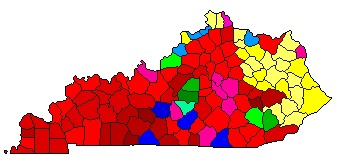
1979 State Auditor Democratic Primary Election Results - Kentucky
Note: The Google advertisement links below may advocate political positions that this site does not endorse.
Data for this Contest was Contributed by on 2007-03-24
State Auditor
Candidate
Political
Party
Popular Vote
James B. Graham
Democratic
121,338
39.08%
Sara Bell
Democratic
69,295
22.32%
George Salem
Democratic
67,724
21.81%
William (Bill) Taylor
Democratic
52,121
16.79%
Map Key
> 20%
> 30%
> 40%
> 50%
> 60%
> 70%
> 80%
Turnout
Maps
Pop. (m)
Demographic Data
1980 Population:
3,660,324
Enum.
1980 Population Density:
35.6
persons/km
2
1979 Population:
0
Est.
1979 Population Density:
0.0
persons/km
2
1970 Population:
3,220,711
Enum.
1970 Population Density:
31.3
persons/km
2
Land Area (2000):
102,896
km
2
Annual Pop Growth Rate:
1.3
%
Election Data and Statistics:
County Data (Table)
(m)
County Data (Graphs)
Purchase Detailed Data
Compare State Maps by Year
View All 1979 Kentucky Maps
Election Tools
Atlas Forum
Image Code for Maps:
County
,
Pop
Data Sources:
Source for Popular Vote data: Kentucky State Board of Elections.
1979 Primary Election Returns
, Kentucky State Board of Elections (http://elect.ky.gov/NR/rdonlyres/E334BE0F-44D1-46FE-9E1F-5C3421133F1A/6239/res_ussenate1.txt) (accessed 24 Mar 2007)
Source for Population data: U.S. Census Bureau.
Results for and Individual County:
(m)
Choose Year
2003
1995
1991
1987
1983
1975
Choose Office
Governor
Lt. Governor
Secretary of State
Agriculture Commissioner
Choose State
Kentucky Election Results Home
-
National Results for 1979
-
Use Frame Navigation
Login
Terms of Use
-
DCMA Policy
-
Privacy Policy and Cookies
©
Dave Leip's Atlas of U.S. Elections, LLC 2019 All Rights Reserved


