| |
Gubernatorial
Candidate | Lt. Gubernatorial
Candidate | Political
Party | Popular Vote |
 | Paul Patton | Steve Henry | Democrat |
352,099 |
60.70% |
 | Peppy Martin | Wanda Cornelius | Republican |
128,788 |
22.20% |
 | Gatewood Galbraith | Kathy Lyons | Reform |
88,930 |
15.33% |
 | Nailah Jumoke-Yarbrough | John Flodstrom | Natural Law |
6,934 |
1.20% |
| Hobert Anderson | Samuel Simpson | Write-in |
3,323 |
0.57% |
 |
Map Key
| > 30% |
 |
 |
| > 40% |
 |
 |
| > 50% |
 |
 |
| > 60% |
 |
 |
| > 70% |
 |
|
| > 80% |
 |
|
| Turnout
 |  |
|
| Maps | 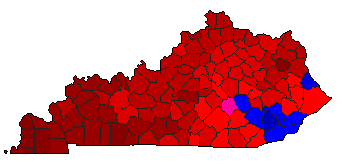 |  |  | | Pop. (m) | | Dem. (m) | | Rep. (m) | | Ref. (m) | | Swg (m) | | Tnd (m) |
| |
| Demographic Data
| 2000 Population: | 4,041,769 | Enum. | 2000 Population Density: | 39.3 | persons/km2 | | 1999 Population: | 4,018,053 | Est. | 1999 Population Density: | 39.0 | persons/km2 | | 1990 Population: | 3,686,892 | Enum. | 1990 Population Density: | 35.8 | persons/km2 | | Land Area (2000): | 102,896 | km2 | Annual Pop Growth Rate: | 0.9 | % |
| Election Data and Statistics:
| Election Tools
- Atlas Forum Image Code for Maps: County, Pop, Tnd, Swg
Data Sources:
- Source for Popular Vote data: Kentucky State Board of Elections. Kentucky State Board of Elections Report of Official Election Night Tally Results Governor & Lt. Governor, Kentucky State Board of Elections (
) (accessed 17 Nov 2005)
- Source for Population data: U.S. Census Bureau.
| Results for and Individual County:
|
|
| |


