Home
2024
Election Results
Election Info
Weblog
Forum
Wiki
Search
Email
Login
Site Info
Store
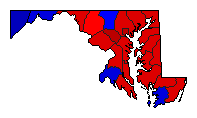
1930 Comptroller General General Election Results - Maryland
Note: The Google advertisement links below may advocate political positions that this site does not endorse.
Data for this Contest was Contributed by on 2016-02-29
Comptroller General
Candidate
Political
Party
Popular Vote
William S. Gordy, Jr.
Democratic
264,284
57.97%
W. Newton Jackson
Republican
184,146
40.39%
Charles L. Myers
Socialist
3,227
0.71%
Samuel Einhorn
Labor
3,223
0.71%
Lena Lipman
Communist
995
0.22%
Map Key
> 40%
> 50%
> 60%
> 70%
Turnout
Maps
Demographic Data
1930 Population:
1,631,526
Enum.
1930 Population Density:
64.5
persons/km
2
1920 Population:
1,449,661
Enum.
1920 Population Density:
57.3
persons/km
2
Land Area (2000):
25,314
km
2
Annual Pop Growth Rate:
1.2
%
Election Data and Statistics:
County Data (Table)
(m)
County Data (Graphs)
(m)
Compare State Data by Year (Table)
Compare State Data by Year (Graphs)
View All 1930 Maryland Data
Compare State Maps by Year
View All 1930 Maryland Maps
Election Tools
Atlas Forum
Image Code for Maps:
County
Data Sources:
Source for Popular Vote data: Maryland Secretary of State.
Maryland Manual 1931
, Maryland Secretary of State (http://msa.maryland.gov/megafile/msa/speccol/sc2900/sc2908/000001/000148/pdf/am148--252.pdf) (accessed 31 Jan 2016)
Source for Population data: U.S. Census Bureau.
Results for and Individual County:
(m)
Choose Year
2022
2018
2014
2010
2006
2002
1998
1994
1990
1986
1982
1978
1974
1970
1966
1962
1958
1954
1950
1946
1942
1938
1934
1926
1923
1921
1919
1917
1915
1913
Choose Office
Governor
Attorney General
Choose State
2022 >
Maryland Election Results Home
-
National Results for 1930
-
Use Frame Navigation
Login
Terms of Use
-
DCMA Policy
-
Privacy Policy and Cookies
©
Dave Leip's Atlas of U.S. Elections, LLC 2019 All Rights Reserved


