Home
2024
Election Results
Election Info
Weblog
Forum
Wiki
Search
Email
Login
Site Info
Store
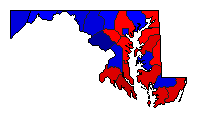
1966 Gubernatorial General Election Results - Maryland
Note: The Google advertisement links below may advocate political positions that this site does not endorse.
Data for this Contest was Contributed by on 2007-05-15
Gubernatorial
Candidate
Political
Party
Popular Vote
Spiro T. Agnew
Republican
455,318
49.50%
George P. Mahoney
Democratic
373,543
40.61%
Hyman A. Pressman
Independent
90,899
9.88%
Map Key
> 40%
> 50%
> 60%
> 70%
Turnout
Maps
Demographic Data
1970 Population:
3,923,897
Enum.
1970 Population Density:
155.0
persons/km
2
1960 Population:
3,100,689
Enum.
1960 Population Density:
122.5
persons/km
2
Land Area (2000):
25,314
km
2
Annual Pop Growth Rate:
2.4
%
Election Data and Statistics:
County Data (Table)
(m)
County Data (Graphs)
Compare State Data by Year (Table)
Compare State Data by Year (Graphs)
View All 1966 Maryland Data
Compare State Maps by Year
View All 1966 Maryland Maps
Election Tools
Atlas Forum
Image Code for Maps:
County
Data Sources:
Source for Popular Vote data: Maryland State Archives.
Maryland Manual, 1967-1968
, Maryland State Archives (http://aomol.net/megafile/msa/speccol/sc2900/sc2908/000001/000173/pdf/am173--503.pdf) (accessed 15 May 2007)
Source for Population data: U.S. Census Bureau.
Results for and Individual County:
(m)
Choose Year
2022
2018
2014
2010
2006
2002
1998
1994
1990
1986
1982
1978
1974
1970
1962
1958
1954
1950
1946
1942
1938
1934
1930
1926
1923
1919
1915
1899
Choose Office
Attorney General
Comptroller General
Choose State
Alabama
Alaska
Arizona
Arkansas
California
Colorado
Connecticut
Florida
Georgia
Iowa
Kansas
Maine
Massachusetts
Michigan
Minnesota
Nebraska
Nevada
New Hampshire
New Mexico
New York
Ohio
Oklahoma
Oregon
Pennsylvania
Rhode Island
South Dakota
Wisconsin
1990 >
Maryland Election Results Home
-
National Results for 1966
-
Use Frame Navigation
Login
Terms of Use
-
DCMA Policy
-
Privacy Policy and Cookies
©
Dave Leip's Atlas of U.S. Elections, LLC 2019 All Rights Reserved


