| |
Gubernatorial
Candidate | Lt. Gubernatorial
Candidate | Political
Party | Popular Vote |
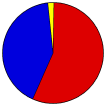
 | Martin O'Malley | Anthony G. Brown | Democratic |
1,044,961 |
56.24% |
 | Robert L. Ehrlich, Jr. | Mary Kane | Republican |
776,319 |
41.79% |
 | Susan J. Gaztanaga | Doug McNeil | Libertarian |
14,137 |
0.76% |
| Maria Allwine | Ken Eidel | Green |
11,825 |
0.64% |
| Eric D. Knowles | Michael Hargadon | Constitution |
8,612 |
0.46% |
| Other (+) | - | - |
2,026 |
0.11% |
 |
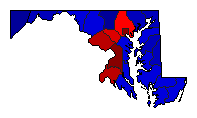
Map Key
| > 40% |
 |
 |
| > 50% |
 |
 |
| > 60% |
 |
 |
| > 70% |
|
 |
| > 80% |
 |
|
| Turnout
 |  |
|
|
| Demographic Data
| 2010 Population: | 5,773,552 | Enum. | 2010 Population Density: | 228.1 | persons/km2 | | 2000 Population: | 5,296,486 | Enum. | 2000 Population Density: | 209.2 | persons/km2 | | Land Area (2000): | 25,314 | km2 | Annual Pop Growth Rate: | 0.9 | % |
| Election Data and Statistics:
| Election Tools
- Atlas Forum Image Code for Maps: County, Pop, Tnd, Swg
Data Sources:
- Source for Popular Vote data: Maryland State Board of Elections. 2010 General Election Official Results, Maryland State Board of Elections (
) (accessed 01 Dec 2010)
- Source for Population data: U.S. Census Bureau.
| Results for and Individual County:
|
| The 2010 Campaign:
|
|
| |


