| |
Presidential
Candidate | Vice Presidential
Candidate | Political
Party | Popular Vote | Electoral Vote |
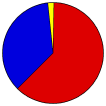
 | Barack H. Obama | Joseph R. Biden, Jr. | Democratic |
1,677,844 |
61.97% | 10 |
 | Willard Mitt Romney | Paul Ryan | Republican |
971,869 |
35.90% | 0 |
 | Gary Johnson | James P. Gray | Libertarian |
30,195 |
1.12% | 0 |
| Jill Stein | Cheri Honkala | Green |
17,110 |
0.63% | 0 |
| Write-ins | - | - |
9,555 |
0.35% | 0 |
| Other (+) | - | - |
754 |
0.03% | 0 |
 |
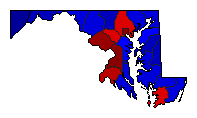
Map Key
| > 40% |
 |
 |
| > 50% |
 |
 |
| > 60% |
 |
 |
| > 70% |
 |
 |
| > 80% |
 |
|
| Turnout
 |  |  |
|
|
| Demographic Data
| 2012 Population: | 5,888,375 | Est. | 2012 Population Density: | 232.6 | persons/km2 | | 2010 Population: | 5,773,552 | Enum. | 2010 Population Density: | 228.1 | persons/km2 | | Total Electoral Vote: | 10 | | Electoral Vote Density: | 588,838 | persons/EV | | Land Area (2000): | 25,314 | km2 | Annual Pop Growth Rate: | 1.0 | % |
| Election Data and Statistics:
| Election Tools
- Atlas Forum Image Code for Maps: County, Pop, Tnd, Swg
Data Sources:
- Source for Popular Vote data: Maryland State Board of Elections. Official 2012 Presidential General Election results for President of the United States, Maryland State Board of Elections (http://www.elections.state.md.us/elections/2012/results/general/gen_detail_results_2012_4_BOT001-.html
) (accessed 28 Nov 2012)
- Source for Population data: U.S. Census Bureau.
| Results for and Individual County:
| | Primary Documentation:
|
| The 2012 Campaign:
|
|
| |


