Home
2024
Election Results
Election Info
Weblog
Forum
Wiki
Search
Email
Login
Site Info
Store
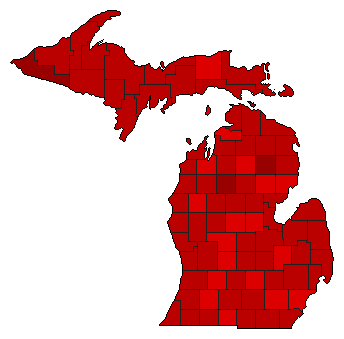
1970 Referendum General Election Results - Michigan
Note: The Google advertisement links below may advocate political positions that this site does not endorse.
Data for this Contest was Contributed by on 2014-03-09
Referendum: Proposal B: Lower Minimum Voting Age from 21 to 18 Years
Popular Vote
No
1,446,884
61.00%
Yes
924,981
39.00%
Map Key
> 40%
> 50%
> 60%
> 70%
Turnout
Maps
Election Notes:
Totals do not reflect corrected county totals following statewide canvass.
Demographic Data
1970 Population:
8,881,826
Enum.
1970 Population Density:
60.4
persons/km
2
1960 Population:
7,823,194
Enum.
1960 Population Density:
53.2
persons/km
2
Land Area (2000):
147,121
km
2
Annual Pop Growth Rate:
1.3
%
Election Data and Statistics:
County Data (Table)
(m)
County Data (Graphs)
Compare State Data by Year (Table)
Compare State Data by Year (Graphs)
View All 1970 Michigan Data
Compare State Maps by Year
View All 1970 Michigan Maps
Election Tools
Atlas Forum
Image Code for Maps:
County
Data Sources:
Source for Popular Vote data: Michigan Department of Administration.
Michigan Manual 1971-1972
, Michigan Department of Administration (http://) (accessed 9 Mar 2014)
Source for Population data: U.S. Census Bureau.
Results for and Individual County:
(m)
Choose Year
2022
2020
2020
2014
2014
2012
2010
2010
2006
2006
2006
2006
2004
2004
2002
2002
1998
1998
1996
1996
1976
1974
1974
1974
Choose Office
Senator
Governor
Secretary of State
Attorney General
Proposal A
Proposal C
Choose State
Illinois
Washington
Washington
Washington
Washington
Michigan Election Results Home
-
National Results for 1970
-
Use Frame Navigation
Login
Terms of Use
-
DCMA Policy
-
Privacy Policy and Cookies
©
Dave Leip's Atlas of U.S. Elections, LLC 2019 All Rights Reserved


