Home
2024
Election Results
Election Info
Weblog
Forum
Wiki
Search
Email
Login
Site Info
Store
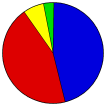
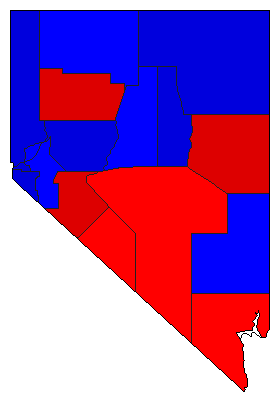
1994 Controller General Election Results - Nevada
Note: The Google advertisement links below may advocate political positions that this site does not endorse.
Data for this Contest was Contributed by on 2018-10-20
Controller
Candidate
Political
Party
Popular Vote
Darrel Daines
Republican
171,162
45.68%
Pete Sferrazza
Democratic
165,515
44.17%
None of these Candidates
24,570
6.56%
Louis Tomburello
Libertarian
13,440
3.59%
Map Key
> 40%
> 50%
> 60%
> 70%
Turnout
Maps
Pop. (m)
Demographic Data
2000 Population:
1,998,257
Enum.
2000 Population Density:
7.0
persons/km
2
1994 Population:
1,499,298
Est.
1994 Population Density:
5.3
persons/km
2
1990 Population:
1,201,675
Enum.
1990 Population Density:
4.2
persons/km
2
Land Area (2000):
284,448
km
2
Annual Pop Growth Rate:
5.2
%
Election Data and Statistics:
County Data (Table)
(m)
County Data (Graphs)
Purchase Detailed Data
Compare State Data by Year (Table)
Compare State Data by Year (Graphs)
View All 1994 Nevada Data
Compare State Maps by Year
View All 1994 Nevada Maps
Election Tools
Atlas Forum
Image Code for Maps:
County
,
Pop
Data Sources:
Source for Popular Vote data: Nevada Secretary of State.
Nevada Secretary of State: Past Election Results - 1962 to Present
, Nevada Secretary of State (https://www.nvsos.gov/sos/home/showdocument?id=3155) (accessed 20 Oct 2018)
Source for Population data: U.S. Census Bureau.
Results for and Individual County:
(m)
Choose Year
2022
2018
2014
2010
2006
2002
1998
1990
1986
1982
1978
1974
1970
1966
1962
1958
1954
1950
1946
1942
1938
1934
1930
1926
1922
1918
1914
1910
1906
1902
1898
1894
1890
1886
1882
1878
1874
1870
1866
1864
Choose Office
Senator
Governor
Lt. Governor
Secretary of State
State Treasurer
Attorney General
Choose State
California
2022 >
Nevada Election Results Home
-
National Results for 1994
-
Use Frame Navigation
Login
Terms of Use
-
DCMA Policy
-
Privacy Policy and Cookies
©
Dave Leip's Atlas of U.S. Elections, LLC 2019 All Rights Reserved


