1998 Controller General Election Results - Nevada
Note: The Google advertisement links below may advocate political positions that this site does not endorse.
Data for this Contest was Contributed by on 2011-01-29

  Controller
Candidate
Political
Party
Popular Vote
Kathy AugustineRepublican 194,017 46.63%
Mary SanadaDemocratic 173,101 41.60%
None of these Candidates- 21,544 5.18%
Jim LeeLibertarian 14,537 3.49%
Thomas F. JeffersonIndependent American 12,868 3.09%
State Seal Map Key
 > 40%
 > 50%
 > 60%
 > 70%
Turnout
Voter Turnout Graph
Vote Pie Chart
Maps
  1998 Nevada County Map of General Election Results for Controller  
County Button
Pop. (m)
Per Vote Republican Button
Per Vote Democratic Button
Per Vote - Button
 
Demographic Data

2000 Population:1,998,257Enum.2000 Population Density:7.0persons/km2
1998 Population:1,853,191Est.1998 Population Density:6.5persons/km2
1990 Population:1,201,675Enum.1990 Population Density:4.2persons/km2
Land Area (2000):284,448km2Annual Pop Growth Rate:5.2%

Election Data and Statistics:
Election Tools
Data Sources:
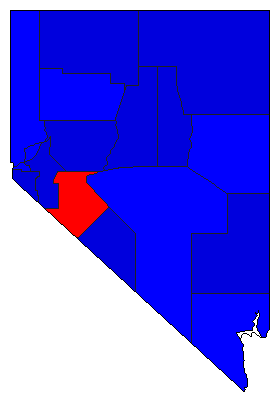
  • Source for Popular Vote data: Nevada Secretary of State. Elections Division. State of Nevada 1998 Official General Election Returns November 3,1998, Nevada Secretary of State. Elections Division (http://nvsos.gov/Modules/ShowDocument.aspx?documentid=192) (accessed 29 Jan 2011)
  • Source for Population data: U.S. Census Bureau.
Results for and Individual County:
  • (m)


Churchill County Clark County Douglas County Elko County Esmeralda County Eureka County Humboldt County Lander County Lincoln County Lyon County Mineral County Nye County Pershing County Storey County Washoe County White Pine County Carson City City