Home
2024
Election Results
Election Info
Weblog
Forum
Wiki
Search
Email
Login
Site Info
Store
1954 Senatorial General Election Results - New Jersey
Note: The Google advertisement links below may advocate political positions that this site does not endorse.
Data for this Contest was Contributed by on 2013-05-08
Senatorial
Candidate
Political
Party
Popular Vote
Clifford P. Case
Republican
861,528
48.66%
Charles R. Howell
Democratic
858,158
48.47%
Henry Krajewski
American Third Party
35,421
2.00%
Fred A. Hartley
-
7,028
0.40%
Albert Ronis
Socialist Labor
4,832
0.27%
George Breitman
Socialist Workers
3,590
0.20%
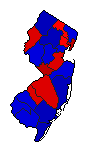
Map Key
> 40%
> 50%
> 60%
> 70%
Turnout
Maps
Election Notes:
Statewide totals the sum of county-level data. Official source lists Hartley vote as 7,025.
Demographic Data
1960 Population:
6,066,782
Enum.
1960 Population Density:
315.8
persons/km
2
1950 Population:
4,835,329
Enum.
1950 Population Density:
251.7
persons/km
2
Land Area (2000):
19,211
km
2
Annual Pop Growth Rate:
2.3
%
Election Data and Statistics:
County Data (Table)
(m)
County Data (Graphs)
(m)
Compare State Data by Year (Table)
Compare State Data by Year (Graphs)
View All 1954 New Jersey Data
Compare State Maps by Year
View All 1954 New Jersey Maps
Election Tools
Atlas Forum
Image Code for Maps:
County
Data Sources:
Source for Popular Vote data: New Jersey Secretary of State.
Results of the General Election Held November 2nd, 1954
, New Jersey Secretary of State (http://www.njelections.org/1920-1970-results/1954-general-election.pdf) (accessed 8 May 2013)
Source for Population data: U.S. Census Bureau.
Results for and Individual County:
(m)
Choose Year
2020
2018
2014
2012
2008
2006
2002
2000
1996
1994
1990
1988
1984
1982
1978
1976
1972
1970
1966
1964
1960
1958
1952
1936
1934
1930
1928
Choose Office
Choose State
Colorado
Delaware
Illinois
Iowa
Kansas
Maine
Massachusetts
Michigan
Minnesota
Montana
New Hampshire
Oregon
Rhode Island
South Carolina
South Dakota
Virginia
West Virginia
1990 >
New Jersey Election Results Home
-
National Results for 1954
-
Use Frame Navigation
Login
Terms of Use
-
DCMA Policy
-
Privacy Policy and Cookies
©
Dave Leip's Atlas of U.S. Elections, LLC 2019 All Rights Reserved


