| |
Presidential
Candidate | Vice Presidential
Candidate | Political
Party | Popular Vote | Electoral Vote |
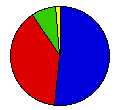
 | Ronald Reagan | George Bush | Republican |
1,546,557 |
51.97% | 17 |
 | James Carter | Walter Mondale | Democrat |
1,147,364 |
38.56% | 0 |
 | John Anderson | Patrick Lucey | And. Alternative |
234,632 |
7.88% | 0 |
 | Edward Clark | David Koch | Libertarian |
20,652 |
0.69% | 0 |
| Barry Commoner | LaDonna Harris | Citizens |
8,203 |
0.28% | 0 |
| Other (+) | - | - |
18,276 |
0.61% | 0 |
 |
Map Key
| Turnout
 |  |  |
|
| Maps | 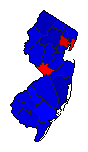 |  | | Pop. (m) | | Rep. (m) | | Dem. (m) | | And. (m) | | Swg (m) | | Tnd (m) |
| |
| Demographic Data
| 1980 Population: | 7,365,011 | Enum. | 1980 Population Density: | 383.4 | persons/km2 | | 1970 Population: | 7,171,112 | Enum. | 1970 Population Density: | 373.3 | persons/km2 | | Total Electoral Vote: | 17 | | Electoral Vote Density: | 433,236 | persons/EV | | Land Area (2000): | 19,211 | km2 | Annual Pop Growth Rate: | 0.3 | % |
| Election Data and Statistics:
| Election Tools
- Atlas Forum Image Code for Maps: County, Pop, Tnd, Swg
Data Sources:
- Source for Popular Vote data: New Jersey Secretary of State, "Votes Cast for President and Vice-President of the United States," State of New Jersey Results of the General Election Held November 4, 1980 (Trenton, 1980)
- Source for Population data: U.S. Census Bureau.
| Results for and Individual County:
|
|
| |


