Home
2024
Election Results
Election Info
Weblog
Forum
Wiki
Search
Email
Login
Site Info
Store
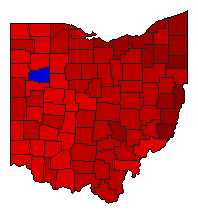
1986 State Auditor General Election Results - Ohio
Note: The Google advertisement links below may advocate political positions that this site does not endorse.
Data for this Contest was Contributed by on 2019-04-18
State Auditor
Candidate
Political
Party
Popular Vote
Thomas E. Ferguson
Democratic
2,005,306
66.46%
Ben Rose
Republican
1,012,037
33.54%
Map Key
> 50%
> 60%
> 70%
> 80%
Turnout
Maps
Pop. (m)
Demographic Data
1990 Population:
10,847,115
Enum.
1990 Population Density:
102.3
persons/km
2
1986 Population:
0
Est.
1986 Population Density:
0.0
persons/km
2
1980 Population:
10,797,603
Enum.
1980 Population Density:
101.8
persons/km
2
Land Area (2000):
106,056
km
2
Annual Pop Growth Rate:
0.0
%
Election Data and Statistics:
County Data (Table)
(m)
County Data (Graphs)
Purchase Detailed Data
Compare State Data by Year (Table)
Compare State Data by Year (Graphs)
View All 1986 Ohio Data
Compare State Maps by Year
View All 1986 Ohio Maps
Election Tools
Atlas Forum
Image Code for Maps:
County
,
Pop
Data Sources:
Source for Popular Vote data: Ohio Secretary of State, "County Vote for Attorney General, Auditor, and Secretary of State,"
Ohio General Election Results for November 7, 1986
(Columbus, 1987)
Source for Population data: U.S. Census Bureau.
Results for and Individual County:
(m)
Choose Year
2022
2018
2014
2010
2006
2002
1998
1994
1990
1982
1978
1974
1970
1966
Choose Office
Senator
Governor
Secretary of State
State Treasurer
Attorney General
Choose State
Alabama
Delaware
Idaho
Indiana
Iowa
Massachusetts
Minnesota
Missouri
Nebraska
New Mexico
Oklahoma
South Dakota
Wyoming
2022 >
Ohio Election Results Home
-
National Results for 1986
-
Use Frame Navigation
Login
Terms of Use
-
DCMA Policy
-
Privacy Policy and Cookies
©
Dave Leip's Atlas of U.S. Elections, LLC 2019 All Rights Reserved


