Home
2024
Election Results
Election Info
Weblog
Forum
Wiki
Search
Email
Login
Site Info
Store
1990 Gubernatorial General Election Results - Ohio
Note: The Google advertisement links below may advocate political positions that this site does not endorse.
Gubernatorial
Candidate
Lt. Gubernatorial
Candidate
Political
Party
Popular Vote
George V. Voinovich
Richard Michael DeWine
Republican
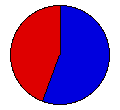
1,938,103
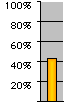
55.73%
Anthony Celebrezze, Jr.
Eugene Branstool
Democratic
1,539,416
44.27%
Write-ins
-
-
131
0.00%
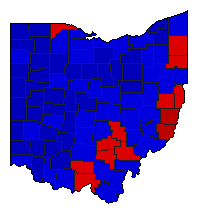
Map Key
> 40%
> 50%
> 60%
> 70%
Turnout
Maps
Pop. (m)
Rep. (m)
Dem. (m)
Demographic Data
1990 Population:
10,847,115
Enum.
1990 Population Density:
102.3
persons/km
2
1980 Population:
10,797,603
Enum.
1980 Population Density:
101.8
persons/km
2
Land Area (2000):
106,056
km
2
Annual Pop Growth Rate:
0.0
%
Election Data and Statistics:
County Data (Table)
(m)
County Data (Graphs)
Purchase Detailed Data
Compare State Data by Year (Table)
Compare State Data by Year (Graphs)
View All 1990 Ohio Data
Compare State Maps by Year
View All 1990 Ohio Maps
Election Tools
Atlas Forum
Image Code for Maps:
County
,
Pop
Data Sources:
Source for Popular Vote data: Ohio Secretary of State, "County Vote for Governor and Lieutenant Governor and Number of Electors Voting General Election, November 6, 1990,"
Election Statistics for 1989-1990
(Cleveland, 1990)
Source for Population data: U.S. Census Bureau.
Results for and Individual County:
(m)
Choose Year
2022
2018
2014
2010
2006
2002
1998
1994
1986
1982
1978
1974
1970
1966
1962
1958
1956
1954
1952
1950
1948
1946
1944
1942
1891
1867
1863
Choose Office
Secretary of State
State Treasurer
Attorney General
State Auditor
Choose State
Alabama
Alaska
Arizona
Arkansas
California
Colorado
Connecticut
Florida
Georgia
Hawaii
Idaho
Illinois
Iowa
Kansas
Maine
Maryland
Massachusetts
Michigan
Minnesota
Nebraska
Nevada
New Hampshire
New Mexico
New York
Oklahoma
Oregon
Pennsylvania
Rhode Island
South Carolina
South Dakota
Tennessee
Texas
Vermont
Wisconsin
Wyoming
1994 >
Ohio Election Results Home
-
National Results for 1990
-
Use Frame Navigation
Login
Terms of Use
-
DCMA Policy
-
Privacy Policy and Cookies
©
Dave Leip's Atlas of U.S. Elections, LLC 2019 All Rights Reserved


