Home
2024
Election Results
Election Info
Weblog
Forum
Wiki
Search
Email
Login
Site Info
Store
2004 Presidential General Election Results - Arizona
Note: The Google advertisement links below may advocate political positions that this site does not endorse.
Presidential
Candidate
Vice Presidential
Candidate
Political
Party
Popular Vote
Electoral Vote
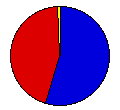
George W. Bush
Richard Cheney
Republican
1,104,294
54.77%
10
John Kerry
John Edwards
Democratic
893,524
44.32%
0
Michael Badnarik
Richard Campagna
Libertarian
11,856
0.59%
0
Other (
+
)
-
-
6,428
0.32%
0
Map Key
> 40%
> 50%
> 60%
> 70%
Turnout
Maps
Demographic Data
2010 Population:
6,392,017
Enum.
2010 Population Density:
21.7
persons/km
2
2004 Population:
5,652,404
Est.
2004 Population Density:
19.2
persons/km
2
2000 Population:
5,130,632
Enum.
2000 Population Density:
17.4
persons/km
2
Total Electoral Vote:
10
Electoral Vote Density:
565,240
persons/EV
Land Area (2000):
294,312
km
2
Annual Pop Growth Rate:
2.2
%
Presidential Electors:
Method of Choosing:
Popular Vote - Winner-Take-All
Table of Presidential Electors for Arizona in 2004
Election Data and Statistics:
County Data (Table)
(m)
County Data (Graphs)
Congressional District Data
(m)
Precinct Data
(m)
Precinct Data Search
(m)
Voter Registration & Turnout Data
(m)
Purchase Detailed Data
Compare State Data by Year (Table)
Compare State Data by Year (Graphs)
View All 2004 Arizona Data
Compare State Maps by Year
View All 2004 Arizona Maps
Arizona JavaCompare
(m)
Election Tools
Atlas Forum
Image Code for Maps:
County
,
CD
,
Pop
,
Prc
,
Tnd
,
Swg
Data Sources:
Source for Popular Vote data: Arizona Secretary of State.
State of Arizona Official Canvass 2004 General Election - November 2, 2004
, Arizona Secretary of State ( ) (accessed 28 Nov 2004)
Source for Population data: U.S. Census Bureau.
Results for and Individual County:
Apache County
Cochise County
Coconino County
Gila County
Graham County
Greenlee County
La Paz County
Maricopa County
Mohave County
Navajo County
Pima County
Pinal County
Santa Cruz County
Yavapai County
Yuma County
Primary Documentation:
2004 Certificate of Ascertainment
(m)
2004 Certificate of Vote
(m)
The 2004 Campaign:
General Election Candidates
Pre-Election Polls
< 2000
Choose Year
2020
2016
2012
2008
2000
1996
1992
1988
1984
1980
1976
1972
1968
1964
1960
1956
1952
1948
1944
1940
1936
1932
1928
1924
1920
1916
1912
Choose Office
Senator
Proposition 200
Choose State
Alabama
Alaska
Arkansas
California
Colorado
Connecticut
Delaware
District of Columbia
Florida
Georgia
Hawaii
Idaho
Illinois
Indiana
Iowa
Kansas
Kentucky
Louisiana
Maine
Maryland
Massachusetts
Michigan
Minnesota
Mississippi
Missouri
Montana
Nebraska
Nevada
New Hampshire
New Jersey
New Mexico
New York
North Carolina
North Dakota
Ohio
Oklahoma
Oregon
Pennsylvania
Rhode Island
South Carolina
South Dakota
Tennessee
Texas
Utah
Vermont
Virginia
Washington
West Virginia
Wisconsin
Wyoming
2008 >
Arizona Election Results Home
-
National Results for 2004
-
Use Frame Navigation
Login
Terms of Use
-
DCMA Policy
-
Privacy Policy and Cookies
©
Dave Leip's Atlas of U.S. Elections, LLC 2019 All Rights Reserved


