Home
2024
Election Results
Election Info
Weblog
Forum
Wiki
Search
Email
Login
Site Info
Store
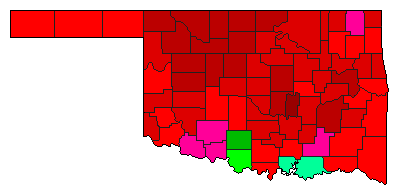
1978 Attorney General Democratic Primary Election Results - Oklahoma
Note: The Google advertisement links below may advocate political positions that this site does not endorse.
Data for this Contest was Contributed by on 2014-07-10
Attorney General
Candidate
Political
Party
Popular Vote
Jan Eric Cartwright
Democratic
255,023
52.11%
Ken Nance
Democratic
88,084
18.00%
Melvin R. Singleterry
Democratic
71,820
14.68%
Ed Morrison
Democratic
41,084
8.39%
Sidney D. Wise
Democratic
33,389
6.82%
Map Key
> 30%
> 40%
> 50%
> 60%
> 70%
Turnout
Maps
Pop. (m)
Demographic Data
1980 Population:
3,025,487
Enum.
1980 Population Density:
17.0
persons/km
2
1978 Population:
0
Est.
1978 Population Density:
0.0
persons/km
2
1970 Population:
2,559,463
Enum.
1970 Population Density:
14.4
persons/km
2
Land Area (2000):
177,847
km
2
Annual Pop Growth Rate:
1.7
%
Election Data and Statistics:
County Data (Table)
(m)
County Data (Graphs)
Purchase Detailed Data
Compare State Maps by Year
View All 1978 Oklahoma Maps
Election Tools
Atlas Forum
Image Code for Maps:
County
,
Pop
Data Sources:
Source for Popular Vote data: Oklahoma State Election Board.
Election Results & Statistics 1978
, Oklahoma State Election Board (http://digitalprairie.ok.gov/cdm/compoundobject/collection/stgovpub/id/9947/rec/15) (accessed 10 Jul 2014)
Source for Population data: U.S. Census Bureau.
Results for and Individual County:
(m)
Choose Year
1994
1986
1982
Choose Office
Senator
Governor
Lt. Governor
State Treasurer
State Auditor
Insurance Commissioner
Choose State
California
Florida
Minnesota
Nevada
Oklahoma Election Results Home
-
National Results for 1978
-
Use Frame Navigation
Login
Terms of Use
-
DCMA Policy
-
Privacy Policy and Cookies
©
Dave Leip's Atlas of U.S. Elections, LLC 2019 All Rights Reserved


