| |
Presidential
Candidate | Vice Presidential
Candidate | Political
Party | Popular Vote | Electoral Vote |
 | Ronald Reagan | George Bush | Republican |
695,570 |
60.50% | 8 |
 | James Carter | Walter Mondale | Democrat |
402,026 |
34.97% | 0 |
 | John Anderson | Patrick Lucey | Independent |
38,284 |
3.33% | 0 |
| Edward Clark | David Koch | Libertarian |
13,828 |
1.20% | 0 |
 |
Map Key
| > 40% |
 |
 |
| > 50% |
 |
 |
| > 60% |
 |
 |
| > 70% |
 |
 |
| > 80% |
|
 |
| Turnout
 |  |  |
|
| Maps | 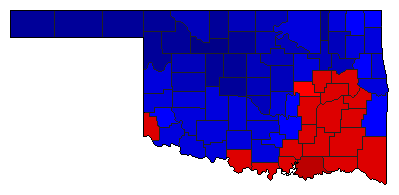 |  | | Pop. (m) | | Rep. (m) | | Dem. (m) | | Swg (m) | | Tnd (m) |
| |
| Demographic Data
| 1980 Population: | 3,025,487 | Enum. | 1980 Population Density: | 17.0 | persons/km2 | | 1970 Population: | 2,559,463 | Enum. | 1970 Population Density: | 14.4 | persons/km2 | | Total Electoral Vote: | 8 | | Electoral Vote Density: | 378,186 | persons/EV | | Land Area (2000): | 177,847 | km2 | Annual Pop Growth Rate: | 1.7 | % |
| Presidential Electors:
- Method of Choosing:Popular Vote - Winner-Take-All
- Table of Presidential Electors for Oklahoma in 1980 (m)
| Election Data and Statistics:
| Election Tools
- Atlas Forum Image Code for Maps: County, Pop, Tnd, Swg
Data Sources:
- Source for Popular Vote data: Oklahoma State Election Board, Official Returns General Election, November 4, 1980 Presidential Electors (Oklahoma City, 0)
- Source for Population data: U.S. Census Bureau.
| Results for and Individual County:
|
|
| |


