Home
2024
Election Results
Election Info
Weblog
Forum
Wiki
Search
Email
Login
Site Info
Store
1984 Attorney General General Election Results - Oregon
Note: The Google advertisement links below may advocate political positions that this site does not endorse.
Data for this Contest was Contributed by on 2015-10-06
Attorney General
Candidate
Political
Party
Popular Vote
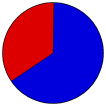
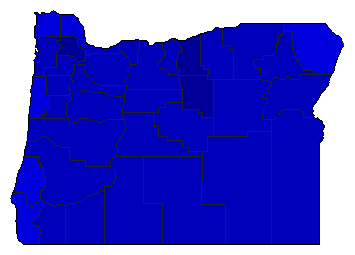
Dave Frohnmayer
Republican
764,658
65.10%
Vern Cook
Democratic
409,430
34.86%
Write-ins
-
417
0.04%
Map Key
> 40%
> 50%
> 60%
> 70%
Turnout
Maps
Pop. (m)
Election Notes:
Statewide totals the sum of county data. Official source lists total Frohnmayer vote as 764,358.
Demographic Data
1990 Population:
2,842,337
Enum.
1990 Population Density:
11.4
persons/km
2
1984 Population:
2,666,598
Est.
1984 Population Density:
10.7
persons/km
2
1980 Population:
2,633,156
Enum.
1980 Population Density:
10.6
persons/km
2
Land Area (2000):
248,631
km
2
Annual Pop Growth Rate:
0.8
%
Election Data and Statistics:
County Data (Table)
(m)
County Data (Graphs)
Purchase Detailed Data
Compare State Data by Year (Table)
Compare State Data by Year (Graphs)
View All 1984 Oregon Data
Compare State Maps by Year
View All 1984 Oregon Maps
Election Tools
Atlas Forum
Image Code for Maps:
County
,
Pop
Data Sources:
Source for Popular Vote data: Oregon Secretary of State.
Official Abstract of Votes General Election November 6, 1984
, Oregon Secretary of State (http://uselectionatlas.org/DOC/OR/OR%201984%20Abstract.pdf) (accessed 6 Oct 2015)
Source for Population data: U.S. Census Bureau.
Results for and Individual County:
(m)
Choose Year
2020
2016
2012
2008
2004
2000
1996
1992
1988
1980
1976
1972
1968
1964
1960
1956
1952
Choose Office
President
Senator
Secretary of State
State Treasurer
Measure 6
Choose State
Indiana
Missouri
Montana
North Carolina
North Dakota
Pennsylvania
Rhode Island
Utah
Washington
West Virginia
Oregon Election Results Home
-
National Results for 1984
-
Use Frame Navigation
Login
Terms of Use
-
DCMA Policy
-
Privacy Policy and Cookies
©
Dave Leip's Atlas of U.S. Elections, LLC 2019 All Rights Reserved


