Home
2024
Election Results
Election Info
Weblog
Forum
Wiki
Search
Email
Login
Site Info
Store
1990 Senatorial General Election Results - Oregon
Note: The Google advertisement links below may advocate political positions that this site does not endorse.
Senatorial
Candidate
Political
Party
Popular Vote
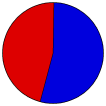
Mark O. Hatfield
Republican
590,095
53.68%
Harry Lonsdale
Democratic
507,743
46.19%
Write-ins
-
1,417
0.13%
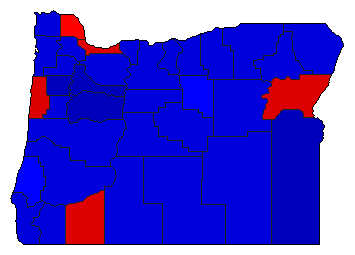
Map Key
> 40%
> 50%
> 60%
> 70%
Turnout
Maps
Pop. (m)
Rep. (m)
Dem. (m)
Demographic Data
1990 Population:
2,842,337
Enum.
1990 Population Density:
11.4
persons/km
2
1980 Population:
2,633,156
Enum.
1980 Population Density:
10.6
persons/km
2
Land Area (2000):
248,631
km
2
Annual Pop Growth Rate:
0.8
%
Election Data and Statistics:
County Data (Table)
(m)
County Data (Graphs)
Purchase Detailed Data
Compare State Data by Year (Table)
Compare State Data by Year (Graphs)
View All 1990 Oregon Data
Compare State Maps by Year
View All 1990 Oregon Maps
Election Tools
Atlas Forum
Image Code for Maps:
County
,
Pop
Data Sources:
Source for Popular Vote data: Oregon Secretary of State. Elections Division, "U.S. Senator,"
Official Abstract of Votes General Election November 6, 1990
(Salem, 1990)
Source for Population data: U.S. Census Bureau.
Results for and Individual County:
(m)
Choose Year
2022
2020
2016
2014
2010
2008
2004
2002
1998
1996
1992
1986
1984
1980
1978
1974
1972
1968
1966
1962
1960
1956
1954
1950
1948
1944
1942
1938
1936
1932
1930
1926
1924
1920
1918
1914
1912
1908
1906
Choose Office
Governor
Choose State
Alabama Class 2
Alaska Class 2
Arkansas Class 2
Colorado Class 2
Delaware Class 2
Georgia Class 2
Hawaii Class 1
Idaho Class 2
Illinois Class 2
Indiana Class 3
Iowa Class 2
Kansas Class 2
Kentucky Class 2
Louisiana Class 2
Maine Class 2
Massachusetts Class 2
Michigan Class 2
Minnesota Class 2
Mississippi Class 2
Montana Class 2
Nebraska Class 2
New Hampshire Class 2
New Jersey Class 2
New Mexico Class 2
North Carolina Class 2
Oklahoma Class 2
Rhode Island Class 2
South Carolina Class 2
South Dakota Class 2
Tennessee Class 2
Texas Class 2
Virginia Class 2
West Virginia Class 2
Wyoming Class 2
1992 >
Oregon Election Results Home
-
National Results for 1990
-
Use Frame Navigation
Login
Terms of Use
-
DCMA Policy
-
Privacy Policy and Cookies
©
Dave Leip's Atlas of U.S. Elections, LLC 2019 All Rights Reserved


