Home
2024
Election Results
Election Info
Weblog
Forum
Wiki
Search
Email
Login
Site Info
Store
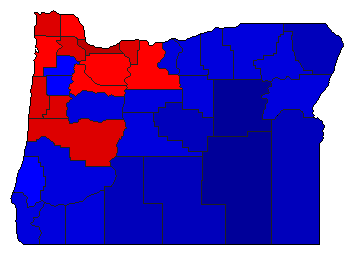
2006 Gubernatorial General Election Results - Oregon
Note: The Google advertisement links below may advocate political positions that this site does not endorse.
Gubernatorial
Candidate
Political
Party
Popular Vote
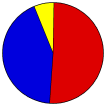
Ted Kulongoski
Democratic
699,786
50.73%
Ron Saxton
Republican
589,748
42.75%
Mary Starrett
Constitution
50,229
3.64%
Joe Keating
Pacific Green
20,030
1.45%
Richard Morley
Libertarian
16,798
1.22%
Write-ins
-
2,884
0.21%
Map Key
> 40%
> 50%
> 60%
> 70%
Turnout
Maps
Demographic Data
2010 Population:
3,831,074
Enum.
2010 Population Density:
15.4
persons/km
2
2006 Population:
3,670,883
Est.
2006 Population Density:
14.8
persons/km
2
2000 Population:
3,421,399
Enum.
2000 Population Density:
13.8
persons/km
2
Land Area (2000):
248,631
km
2
Annual Pop Growth Rate:
1.1
%
Election Data and Statistics:
County Data (Table)
(m)
County Data (Graphs)
Voter Registration & Turnout Data
(m)
Purchase Detailed Data
Compare State Data by Year (Table)
Compare State Data by Year (Graphs)
View All 2006 Oregon Data
Compare State Maps by Year
View All 2006 Oregon Maps
Election Tools
Atlas Forum
Image Code for Maps:
County
,
Pop
,
Tnd
,
Swg
Data Sources:
Source for Popular Vote data:
Source for Population data: U.S. Census Bureau.
Results for and Individual County:
Baker County
Benton County
Clackamas County
Clatsop County
Columbia County
Coos County
Crook County
Curry County
Deschutes County
Douglas County
Gilliam County
Grant County
Harney County
Hood River County
Jackson County
Jefferson County
Josephine County
Klamath County
Lake County
Lane County
Lincoln County
Linn County
Malheur County
Marion County
Morrow County
Multnomah County
Polk County
Sherman County
Tillamook County
Umatilla County
Union County
Wallowa County
Wasco County
Washington County
Wheeler County
Yamhill County
The 2006 Campaign:
Pre-Election Polls
< 2002
Choose Year
2022
2018
2016
2014
2010
2002
1998
1994
1990
1986
1982
1978
1974
1970
1966
1962
1958
1956
1954
1950
1946
1942
1938
1934
1930
1926
1922
1918
1914
1910
1906
1902
1898
1894
1890
1886
1882
1878
1874
1870
1866
Choose Office
Measure 43
Measure 40
Measure 48
Measure 42
Measure 47
Choose State
Alabama
Alaska
Arizona
Arkansas
California
Colorado
Connecticut
Florida
Georgia
Hawaii
Idaho
Illinois
Iowa
Kansas
Maine
Maryland
Massachusetts
Michigan
Minnesota
Nebraska
Nevada
New Hampshire
New Mexico
New York
Ohio
Oklahoma
Pennsylvania
Rhode Island
South Carolina
South Dakota
Tennessee
Texas
Vermont
Wisconsin
Wyoming
2010 >
Oregon Election Results Home
-
National Results for 2006
-
Use Frame Navigation
Login
Terms of Use
-
DCMA Policy
-
Privacy Policy and Cookies
©
Dave Leip's Atlas of U.S. Elections, LLC 2019 All Rights Reserved


