Home
2024
Election Results
Election Info
Weblog
Forum
Wiki
Search
Email
Login
Site Info
Store
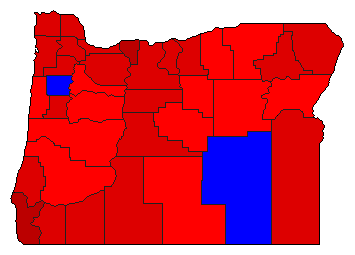
2006 Gubernatorial Democratic Primary Election Results - Oregon
Note: The Google advertisement links below may advocate political positions that this site does not endorse.
Data for this Contest was Contributed by on 2007-01-14
* Unofficial Results *
Gubernatorial
Candidate
Political
Party
Popular Vote
Ted Kulongoski
Democratic
170,944
53.56%
Jim Hill
Democratic
92,439
28.96%
Pete Sorenson
Democratic
51,346
16.09%
Miscellaneous
Democratic
4,448
1.39%
Map Key
> 40%
> 50%
> 60%
> 70%
Turnout
Maps
Demographic Data
2010 Population:
3,831,074
Enum.
2010 Population Density:
15.4
persons/km
2
2006 Population:
3,670,883
Est.
2006 Population Density:
14.8
persons/km
2
2000 Population:
3,421,399
Enum.
2000 Population Density:
13.8
persons/km
2
Land Area (2000):
248,631
km
2
Annual Pop Growth Rate:
1.1
%
Election Data and Statistics:
County Data (Table)
(m)
County Data (Graphs)
Purchase Detailed Data
Compare State Maps by Year
View All 2006 Oregon Maps
Election Tools
Atlas Forum
Image Code for Maps:
County
,
Pop
Data Sources:
Source for Popular Vote data: Oregon Secretary of State.
Official Results- May 16, 2006, Primary Election
, Oregon Secretary of State (http://www.sos.state.or.us/elections/may162006/p06results.html) (accessed 14 Jan 2006)
Source for Population data: U.S. Census Bureau.
Results for and Individual County:
Baker County
Benton County
Clackamas County
Clatsop County
Columbia County
Coos County
Crook County
Curry County
Deschutes County
Douglas County
Gilliam County
Grant County
Harney County
Hood River County
Jackson County
Jefferson County
Josephine County
Klamath County
Lake County
Lane County
Lincoln County
Linn County
Malheur County
Marion County
Morrow County
Multnomah County
Polk County
Sherman County
Tillamook County
Umatilla County
Union County
Wallowa County
Wasco County
Washington County
Wheeler County
Yamhill County
Choose Year
2022
2018
2016
2014
2010
2002
1998
1994
1990
1986
1982
1978
1974
1970
1966
1962
1958
1956
1950
Choose Office
Choose State
Alabama
California
Connecticut
Florida
Georgia
Idaho
Illinois
Iowa
Maine
Minnesota
Nebraska
Nevada
New York
Ohio
South Carolina
South Dakota
Texas
Wyoming
Oregon Election Results Home
-
National Results for 2006
-
Use Frame Navigation
Login
Terms of Use
-
DCMA Policy
-
Privacy Policy and Cookies
©
Dave Leip's Atlas of U.S. Elections, LLC 2019 All Rights Reserved


