1994 Lt. Gubernatorial General Election Results - Rhode Island
Note: The Google advertisement links below may advocate political positions that this site does not endorse.
Data for this Contest was Contributed by on 2017-06-12

  Lt. Gubernatorial
Candidate
Political
Party
Popular Vote
Robert A. WeygandDemocratic 225,234 67.16%
John FeroceRepublican 90,120 26.87%
Jeffrey Curtis JohnsonIndependent 20,032 5.97%
State Seal Map Key
 > 40%
 > 50%
 > 60%
 > 70%
Turnout
Voter Turnout Graph
Vote Pie Chart
Maps
  1994 Rhode Island County Map of General Election Results for Lt. Governor  
County Button
Pop. (m)
Per Vote Democratic Button
Per Vote Republican Button
Per Vote Independent Button
 
Demographic Data

2000 Population:1,048,319Enum.2000 Population Density:387.4persons/km2
1994 Population:1,015,960Est.1994 Population Density:375.4persons/km2
1990 Population:1,003,464Enum.1990 Population Density:370.8persons/km2
Land Area (2000):2,706km2Annual Pop Growth Rate:0.4%

Election Data and Statistics:
Election Tools
Data Sources:
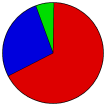
  • Source for Popular Vote data: State of Rhode Island Board of Elections. Official Count of the Ballots Cast, State of Rhode Island Board of Elections (http://www.elections.state.ri.us/publications/Election_Publications/Countbooks/1994%20Count%20Book.pdf) (accessed 12 June 2017)
  • Source for Population data: U.S. Census Bureau.
Results for and Individual County:
  • (m)


Bristol County Kent County Newport County Providence County Washington County