Home
2024
Election Results
Election Info
Weblog
Forum
Wiki
Search
Email
Login
Site Info
Store
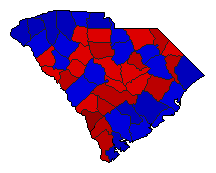
2006 Gubernatorial General Election Results - South Carolina
Note: The Google advertisement links below may advocate political positions that this site does not endorse.
Gubernatorial
Candidate
Political
Party
Popular Vote
Mark Sanford
Republican
601,868
55.12%
Tommy Moore
Democratic
489,076
44.79%
1,008
0.09%
Map Key
> 40%
> 50%
> 60%
> 70%
Turnout
Maps
Demographic Data
2010 Population:
4,625,364
Enum.
2010 Population Density:
59.3
persons/km
2
2006 Population:
4,357,847
Est.
2006 Population Density:
55.9
persons/km
2
2000 Population:
4,012,012
Enum.
2000 Population Density:
51.4
persons/km
2
Land Area (2000):
77,983
km
2
Annual Pop Growth Rate:
1.4
%
Election Data and Statistics:
County Data (Table)
(m)
County Data (Graphs)
Voter Registration & Turnout Data
(m)
Purchase Detailed Data
Compare State Data by Year (Table)
Compare State Data by Year (Graphs)
View All 2006 South Carolina Data
Compare State Maps by Year
View All 2006 South Carolina Maps
Election Tools
Atlas Forum
Image Code for Maps:
County
,
Pop
,
Tnd
,
Swg
Data Sources:
Source for Popular Vote data:
Source for Population data: U.S. Census Bureau.
Results for and Individual County:
Abbeville County
Aiken County
Allendale County
Anderson County
Bamberg County
Barnwell County
Beaufort County
Berkeley County
Calhoun County
Charleston County
Cherokee County
Chester County
Chesterfield County
Clarendon County
Colleton County
Darlington County
Dillon County
Dorchester County
Edgefield County
Fairfield County
Florence County
Georgetown County
Greenville County
Greenwood County
Hampton County
Horry County
Jasper County
Kershaw County
Lancaster County
Laurens County
Lee County
Lexington County
McCormick County
Marion County
Marlboro County
Newberry County
Oconee County
Orangeburg County
Pickens County
Richland County
Saluda County
Spartanburg County
Sumter County
Union County
Williamsburg County
York County
The 2006 Campaign:
Pre-Election Polls
< 2002
Choose Year
2022
2018
2014
2010
2002
1998
1994
1990
1986
1982
1978
1974
1970
Choose Office
Lt. Governor
Secretary of State
State Treasurer
Attorney General
Comptroller General
Agriculture Commissioner
Amendment 1
Choose State
Alabama
Alaska
Arizona
Arkansas
California
Colorado
Connecticut
Florida
Georgia
Hawaii
Idaho
Illinois
Iowa
Kansas
Maine
Maryland
Massachusetts
Michigan
Minnesota
Nebraska
Nevada
New Hampshire
New Mexico
New York
Ohio
Oklahoma
Oregon
Pennsylvania
Rhode Island
South Dakota
Tennessee
Texas
Vermont
Wisconsin
Wyoming
2010 >
South Carolina Election Results Home
-
National Results for 2006
-
Use Frame Navigation
Login
Terms of Use
-
DCMA Policy
-
Privacy Policy and Cookies
©
Dave Leip's Atlas of U.S. Elections, LLC 2019 All Rights Reserved


