| |
Presidential
Candidate | Vice Presidential
Candidate | Political
Party | Popular Vote | Electoral Vote |
 | Gerald Ford | Robert Dole | Republican |
151,505 |
50.39% | 4 |
 | James Carter | Walter Mondale | Democrat |
147,068 |
48.91% | 0 |
 | Roger MacBride | David Bergland | Independent |
1,619 |
0.54% | 0 |
| Other (+) | - | - |
486 |
0.16% | 0 |
 |
Map Key
| Turnout
 |  |  |
|
| Maps | 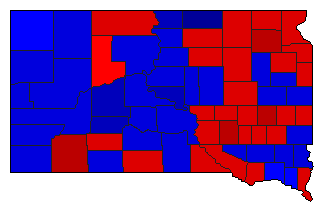 |  | | Pop. (m) | | C.D. (m) | | Rep. (m) | | Dem. (m) | | Swg (m) | | Tnd (m) |
| |
| Demographic Data
| 1980 Population: | 690,768 | Enum. | 1980 Population Density: | 3.5 | persons/km2 | | 1976 Population: | 686,843 | Est. | 1976 Population Density: | 3.5 | persons/km2 | | 1970 Population: | 666,257 | Enum. | 1970 Population Density: | 3.4 | persons/km2 | | Total Electoral Vote: | 4 | | Electoral Vote Density: | 171,711 | persons/EV | | Land Area (2000): | 196,540 | km2 | Annual Pop Growth Rate: | 0.4 | % |
| Election Data and Statistics:
- County Data (Table) (m)
- County Data (Graphs)
- Congressional District Data (m)
- Voter Registration & Turnout Data (m)
|
| | Election Tools
- Atlas Forum Image Code for Maps: County, CD, Pop, Tnd, Swg
Data Sources:
- Source for Popular Vote data: South Dakota Secretary of State, comp., Official Election Returns by Counties for the State of South Dakota General Election November 2, 1976 (Pierre, 1976)
- Source for Population data: U.S. Census Bureau.
| Results for and Individual County:
|
|
| |


