| |
Presidential
Candidate | Vice Presidential
Candidate | Political
Party | Popular Vote | Electoral Vote |
 | William Clinton | Albert Gore Jr. | Democratic |
933,521 |
47.08% | 11 |
 | George Bush | J. Danforth Quayle | Republican |
841,300 |
42.43% | 0 |
 | H. Ross Perot | James Stockdale | Independent |
199,968 |
10.09% | 0 |
 | Other (+) | - | - |
7,849 |
0.40% | 0 |
 |
Map Key
| Turnout
 |  |  |
|
| Maps | 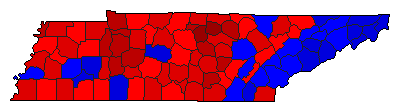 |  |  | | Pop. (m) | | Dem. (m) | | Rep. (m) | | Ind. (m) | | Swg (m) | | Tnd (m) |
| |
| Demographic Data
| 2000 Population: | 5,689,283 | Enum. | 2000 Population Density: | 53.3 | persons/km2 | | 1992 Population: | 5,049,742 | Est. | 1992 Population Density: | 47.3 | persons/km2 | | 1990 Population: | 4,877,203 | Enum. | 1990 Population Density: | 45.7 | persons/km2 | | Total Electoral Vote: | 11 | | Electoral Vote Density: | 459,067 | persons/EV | | Land Area (2000): | 106,752 | km2 | Annual Pop Growth Rate: | 1.6 | % |
| Election Data and Statistics:
| Election Tools
- Atlas Forum Image Code for Maps: County, Pop, Tnd, Swg
Data Sources:
- Source for Popular Vote data: Tennessee Secretary of State, State of Tennessee Electors for President of the United States November 3, 1992 General Election. (Nashville, 1992)
- Source for Population data: U.S. Census Bureau.
| Results for and Individual County:
|
|
| |


