Home
2024
Election Results
Election Info
Weblog
Forum
Wiki
Search
Email
Login
Site Info
Store
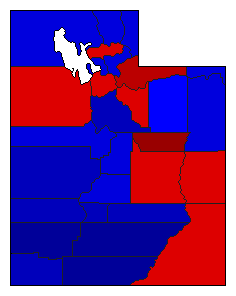
1992 Attorney General General Election Results - Utah
Note: The Google advertisement links below may advocate political positions that this site does not endorse.
Data for this Contest was Contributed by on 2008-03-20
Attorney General
Candidate
Political
Party
Popular Vote
Jan Graham
Democratic
364,119
49.17%
Scott Burns
Republican
358,766
48.44%
John M. Coombs
Libertarian
17,690
2.39%
Map Key
> 40%
> 50%
> 60%
> 70%
Turnout
Maps
Pop. (m)
Demographic Data
2000 Population:
2,233,169
Enum.
2000 Population Density:
10.5
persons/km
2
1992 Population:
1,836,799
Est.
1992 Population Density:
8.6
persons/km
2
1990 Population:
1,722,850
Enum.
1990 Population Density:
8.1
persons/km
2
Land Area (2000):
212,751
km
2
Annual Pop Growth Rate:
2.6
%
Election Data and Statistics:
County Data (Table)
(m)
County Data (Graphs)
Purchase Detailed Data
Compare State Data by Year (Table)
Compare State Data by Year (Graphs)
View All 1992 Utah Data
Compare State Maps by Year
View All 1992 Utah Maps
Election Tools
Atlas Forum
Image Code for Maps:
County
,
Pop
Data Sources:
Source for Popular Vote data: State of Utah Elections Office.
General Election Report
, State of Utah Elections Office (http://elections.utah.gov/Results/Election%20Results%20General%201992.pdf) (accessed 20 Mar 2008)
Source for Population data: U.S. Census Bureau.
Results for and Individual County:
(m)
Choose Year
2020
2016
2014
2012
2008
2004
2000
1996
1988
1984
1960
1940
1924
Choose Office
President
Senator
Governor
State Treasurer
State Auditor
Choose State
Indiana
Missouri
Montana
North Dakota
Oregon
Pennsylvania
Rhode Island
Washington
West Virginia
Utah Election Results Home
-
National Results for 1992
-
Use Frame Navigation
Login
Terms of Use
-
DCMA Policy
-
Privacy Policy and Cookies
©
Dave Leip's Atlas of U.S. Elections, LLC 2019 All Rights Reserved


