Home
2024
Election Results
Election Info
Weblog
Forum
Wiki
Search
Email
Login
Site Info
Store
2006 Senatorial General Election Results - Utah
Note: The Google advertisement links below may advocate political positions that this site does not endorse.
Senatorial
Candidate
Political
Party
Popular Vote
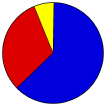
Orrin G. Hatch
Republican
356,238
62.36%
Pete Ashdown
Democratic
177,459
31.06%
Scott N. Bradley
Constitution
21,526
3.77%
Roger I. Price
Personal Choice
9,089
1.59%
Dave Starr Seely
Libertarian
4,428
0.78%
Julian Hatch
Desert Greens
2,512
0.44%
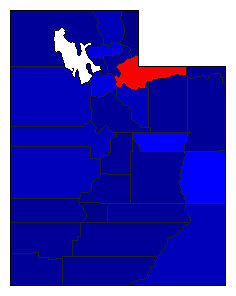
Map Key
> 40%
> 50%
> 60%
> 70%
> 80%
Turnout
Maps
Demographic Data
2010 Population:
2,763,885
Enum.
2010 Population Density:
13.0
persons/km
2
2006 Population:
2,525,507
Est.
2006 Population Density:
11.9
persons/km
2
2000 Population:
2,233,169
Enum.
2000 Population Density:
10.5
persons/km
2
Land Area (2000):
212,751
km
2
Annual Pop Growth Rate:
2.2
%
Election Data and Statistics:
County Data (Table)
(m)
County Data (Graphs)
Voter Registration & Turnout Data
(m)
Purchase Detailed Data
Compare State Data by Year (Table)
Compare State Data by Year (Graphs)
View All 2006 Utah Data
Compare State Maps by Year
View All 2006 Utah Maps
Election Tools
Atlas Forum
Image Code for Maps:
County
,
Pop
,
Tnd
,
Swg
Data Sources:
Source for Popular Vote data:
Source for Population data: U.S. Census Bureau.
Results for and Individual County:
Beaver County
Box Elder County
Cache County
Carbon County
Daggett County
Davis County
Duchesne County
Emery County
Garfield County
Grand County
Iron County
Juab County
Kane County
Millard County
Morgan County
Piute County
Rich County
Salt Lake County
San Juan County
Sanpete County
Sevier County
Summit County
Tooele County
Uintah County
Utah County
Wasatch County
Washington County
Wayne County
Weber County
The 2006 Campaign:
Pre-Election Polls
< 2004
Choose Year
2022
2018
2016
2012
2010
2004
2000
1998
1994
1992
1988
1986
1982
1980
1976
1974
1970
1968
1964
1962
1956
1950
1940
1938
1932
1928
1920
Choose Office
Choose State
Arizona Class 1
California Class 1
Connecticut Class 1
Delaware Class 1
Florida Class 1
Hawaii Class 1
Indiana Class 1
Maine Class 1
Maryland Class 1
Massachusetts Class 1
Michigan Class 1
Minnesota Class 1
Mississippi Class 1
Missouri Class 1
Montana Class 1
Nebraska Class 1
Nevada Class 1
New Jersey Class 1
New Mexico Class 1
New York Class 1
North Dakota Class 1
Ohio Class 1
Pennsylvania Class 1
Rhode Island Class 1
Tennessee Class 1
Texas Class 1
Vermont Class 1
Virginia Class 1
Washington Class 1
West Virginia Class 1
Wisconsin Class 1
Wyoming Class 1
District of Columbia
2010 >
Utah Election Results Home
-
National Results for 2006
-
Use Frame Navigation
Login
Terms of Use
-
DCMA Policy
-
Privacy Policy and Cookies
©
Dave Leip's Atlas of U.S. Elections, LLC 2019 All Rights Reserved


