Home
2024
Election Results
Election Info
Weblog
Forum
Wiki
Search
Email
Login
Site Info
Store
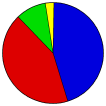
2002 Gubernatorial General Election Results - Vermont
Note: The Google advertisement links below may advocate political positions that this site does not endorse.
Gubernatorial
Candidate
Political
Party
Popular Vote
Jim Douglas
Republican
103,436
44.94%
Doug Racine
Democratic
97,565
42.39%
Cornelius Hogan
Independent
22,353
9.71%
Cris Ericson
Make Marijuana Legal
1,737
0.75%
Michael Badamo
Progressive
1,380
0.60%
Joel Williams
Libertarian
938
0.41%
Patricia Hejny
VT Grassroots
771
0.33%
Marilynn Christian
Restore Justice-Freedom
638
0.28%
Pete Diamondstone
Liberty Union
625
0.27%
Other (
+
)
-
718
0.31%
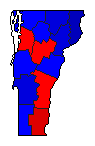
Map Key
> 40%
> 50%
> 60%
> 70%
Turnout
Maps
Demographic Data
2010 Population:
625,741
Enum.
2010 Population Density:
26.1
persons/km
2
2002 Population:
615,442
Est.
2002 Population Density:
25.7
persons/km
2
2000 Population:
608,827
Enum.
2000 Population Density:
25.4
persons/km
2
Land Area (2000):
23,956
km
2
Annual Pop Growth Rate:
0.3
%
Election Data and Statistics:
County Data (Table)
(m)
County Data (Graphs)
City and Town Data
(m)
Purchase Detailed Data
Compare State Data by Year (Table)
Compare State Data by Year (Graphs)
View All 2002 Vermont Data
Compare State Maps by Year
View All 2002 Vermont Maps
Election Tools
Atlas Forum
Image Code for Maps:
County
,
Town
,
Pop
,
Tnd
,
Swg
Data Sources:
Source for Popular Vote data: Vermont Office of the Secretary of State.
General Election - November 5, 2002
, Vermont Office of the Secretary of State ( ) (accessed 29 Mar 2006)
Source for Population data: U.S. Census Bureau.
Results for and Individual County:
Addison County
Bennington County
Caledonia County
Chittenden County
Essex County
Franklin County
Grand Isle County
Lamoille County
Orange County
Orleans County
Rutland County
Washington County
Windham County
Windsor County
< 2000
Choose Year
2022
2020
2018
2016
2014
2012
2010
2008
2006
2004
2000
1998
1996
1994
1992
1990
1988
1986
1984
1982
1980
1978
1976
1974
1970
1968
1962
1960
1958
1952
1944
1938
1936
1930
1920
1918
1912
1793
Choose Office
Lt. Governor
Secretary of State
State Treasurer
Attorney General
State Auditor
Choose State
Alabama
Alaska
Arizona
Arkansas
California
Colorado
Connecticut
Florida
Georgia
Hawaii
Idaho
Illinois
Iowa
Kansas
Maine
Maryland
Massachusetts
Michigan
Minnesota
Nebraska
Nevada
New Hampshire
New Mexico
New York
Ohio
Oklahoma
Oregon
Pennsylvania
Rhode Island
South Carolina
South Dakota
Tennessee
Texas
Wisconsin
Wyoming
2004 >
Vermont Election Results Home
-
National Results for 2002
-
Use Frame Navigation
Login
Terms of Use
-
DCMA Policy
-
Privacy Policy and Cookies
©
Dave Leip's Atlas of U.S. Elections, LLC 2019 All Rights Reserved


