Home
2024
Election Results
Election Info
Weblog
Forum
Wiki
Search
Email
Login
Site Info
Store
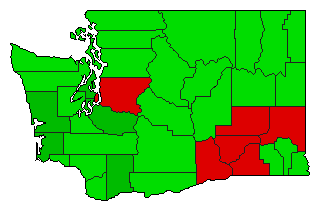
1974 Referendum General Election Results - Washington
Note: The Google advertisement links below may advocate political positions that this site does not endorse.
Data for this Contest was Contributed by on 2007-01-21
Referendum: Referendum Bill 140 (Veto Restrictions)
Popular Vote
Yes
498,745
54.32%
No
419,437
45.68%
Map Key
> 40%
> 50%
> 60%
> 70%
Turnout
Maps
Pop. (m)
Election Notes:
Shall the governor's item veto power be restricted and the legislature be permitted to reconvene itself to consider vetoed bills?
Demographic Data
1980 Population:
4,132,353
Enum.
1980 Population Density:
24.0
persons/km
2
1974 Population:
0
Est.
1974 Population Density:
0.0
persons/km
2
1970 Population:
3,413,244
Enum.
1970 Population Density:
19.8
persons/km
2
Land Area (2000):
172,348
km
2
Annual Pop Growth Rate:
1.9
%
Election Data and Statistics:
County Data (Table)
(m)
County Data (Graphs)
Compare State Data by Year (Table)
Compare State Data by Year (Graphs)
View All 1974 Washington Data
Compare State Maps by Year
View All 1974 Washington Maps
Election Tools
Atlas Forum
Image Code for Maps:
County
,
Pop
Data Sources:
Source for Popular Vote data: Washington Secretary of State.
Washington Ballot Measures Election Results
, Washington Secretary of State (http://secstate.wa.gov/elections/) (accessed 21 Jan 2007)
Source for Population data: U.S. Census Bureau.
Results for and Individual County:
(m)
Choose Year
2020
2019
2012
2010
2010
2010
2008
2002
2002
1997
1995
1995
1994
1991
1987
1986
1980
1980
1979
1977
1977
1975
1973
1973
1973
1972
1972
1972
1972
1972
1972
1972
1972
1970
1970
1970
1970
Choose Office
Senator
Choose State
Michigan
Michigan
Michigan
Washington Election Results Home
-
National Results for 1974
-
Use Frame Navigation
Login
Terms of Use
-
DCMA Policy
-
Privacy Policy and Cookies
©
Dave Leip's Atlas of U.S. Elections, LLC 2019 All Rights Reserved


