-
** ** 2006 Gubernatorial General Election Results - Wyoming ** **
-
  Gubernatorial
Candidate
Political
Party
Popular Vote
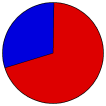
Dave FreudenthalDemocratic 135,516 69.89%
Ray HunkinsRepublican 58,100 29.97%
Write-ins- 276 0.14%
State Seal Map Key
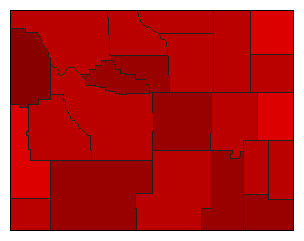
 > 50%
 > 60%
 > 70%
 > 80%
Turnout
Voter Turnout Graph
Vote Pie Chart
Maps
  2006 Wyoming County Map of General Election Results for Governor  
County Button
2000 Button
Pop Button
Per Vote Democratic Button
Per Vote Republican Button
Swing Map Button
Trend Map Button
 
Demographic Data

2010 Population:563,626Enum.2010 Population Density:2.2persons/km2
2006 Population:522,667Est.2006 Population Density:2.1persons/km2
2000 Population:493,782Enum.2000 Population Density:2.0persons/km2
Land Area (2000):251,489km2Annual Pop Growth Rate:1.3%

Election Data and Statistics:
Election Tools
Data Sources:
  • Source for Popular Vote data:
  • Source for Population data: U.S. Census Bureau.
Results for and Individual County:
  • County Menu
The 2006 Campaign:

National Results for 2006 - View No-Frames Version of this Page

Login

Terms of Use - DCMA Policy - Privacy Policy and Cookies


© Dave Leip's Atlas of U.S. Elections, LLC 2019 All Rights Reserved

Note: The advertisement links below may advocate political positions that this site does not endorse.
Albany County Big Horn County Campbell County Carbon County Converse County Crook County Fremont County Goshen County Hot Springs County Johnson County Laramie County Lincoln County Natrona County Niobrara County Park County Platte County Sheridan County Sublette County Sweetwater County Teton County Uinta County Washakie County Weston County