| |
Gubernatorial
Candidate | Lt. Gubernatorial
Candidate | Political
Party | Popular Vote |
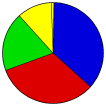
 | John G. Rowland | M. Jodi Rell | Republican |
415,201 |
36.20% |
 | Bill Curry | Joseph P. Ganim | Democratic |
375,133 |
32.70% |
 | Eunice Strong Groark | Audrey Rowe | A Connecticut Party |
216,585 |
18.88% |
 | Tom Scott | Glen R. O'Keefe | Independence |
130,128 |
11.34% |
| Joseph A. Zdonczyk | Robert B. Ratchford | Concerned Citizens |
10,007 |
0.87% |
| Write-ins | - | - |
30 |
0.00% |
 |
Map Key
| Turnout
 |  |
|
| Maps |  |  |  | | Pop. (m) | | Town (m) | | Rep. (m) | | Dem. (m) | | A C. (m) | | Ind. (m) | | Swg (m) | | Tnd (m) |
| |
| Demographic Data
| 2000 Population: | 3,405,565 | Enum. | 2000 Population Density: | 271.4 | persons/km2 | | 1994 Population: | 3,316,121 | Est. | 1994 Population Density: | 264.3 | persons/km2 | | 1990 Population: | 3,287,116 | Enum. | 1990 Population Density: | 262.0 | persons/km2 | | Land Area (2000): | 12,548 | km2 | Annual Pop Growth Rate: | 0.4 | % |
| Election Data and Statistics:
| Election Tools
- Atlas Forum Image Code for Maps: County, Town, Pop, Tnd, Swg
Data Sources:
- Source for Popular Vote data: State of Connecticut Secretary of State, "Vote for Governor and Lieutanant Governor, November 8, 1994," Statement of Vote General Election November 8, 1994 (Hartford, 1994)
- Source for Population data: U.S. Census Bureau.
| Results for and Individual County:
|
|
| |


