| |
Presidential
Candidate | Vice Presidential
Candidate | Political
Party | Popular Vote | Electoral Vote |
 | Richard Nixon | Spiro Agnew | Republican |
1,791,014 |
45.23% | 26 |
 | Hubert Humphrey | Edmund Muskie | Democrat |
1,700,586 |
42.95% | 0 |
 | George Wallace | S. Marvin Griffin | American Ind. |
467,495 |
11.81% | 0 |
 | Dick Gregory | Mark Lane | Write-in |
372 |
0.01% | 0 |
| Henning Blomen | George Taylor | Write-in |
120 |
0.00% | 0 |
| Fred Halstead | Paul Boutelle | Write-in |
69 |
0.00% | 0 |
| Charlene Mitchell | Michael Zagarell | Write-in |
23 |
0.00% | 0 |
| E. Harold Munn | Rolland Fisher | Write-in |
19 |
0.00% | 0 |
 |
Map Key
| Turnout
 |  |  |
|
| Maps | 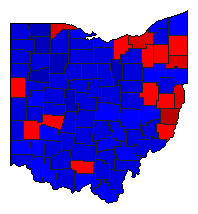 |  | | Rep. (m) | | Dem. (m) | | Ame. (m) | | Swg (m) | | Tnd (m) |
| |
| Demographic Data
| 1970 Population: | 10,657,423 | Enum. | 1970 Population Density: | 100.5 | persons/km2 | | 1960 Population: | 9,706,397 | Enum. | 1960 Population Density: | 91.5 | persons/km2 | | Total Electoral Vote: | 26 | | | Land Area (2000): | 106,056 | km2 | Annual Pop Growth Rate: | 0.9 | % |
| Election Data and Statistics:
| Election Tools
- Atlas Forum Image Code for Maps: County, Tnd, Swg
Data Sources:
- Source for Popular Vote data: Ohio Secretary of State, Ohio Election Statistics Election and Registration Statistics General Election, 1968 (Cleveland, 1969)
- Source for Population data: U.S. Census Bureau.
| Results for and Individual County:
|
|
| |


