| |
Presidential
Candidate | Vice Presidential
Candidate | Political
Party | Popular Vote | Electoral Vote |
 | William Clinton | Albert Gore Jr. | Democratic |
2,453,350 |
48.58% | 22 |
 | George Bush | J. Danforth Quayle | Republican |
1,734,096 |
34.34% | 0 |
 | H. Ross Perot | James Stockdale | Independent |
840,515 |
16.64% | 0 |
 | Andre Marrou | Nancy Lord | Libertarian |
9,218 |
0.18% | 0 |
| Lenore Fulani | Maria Munoz | New Alliance |
5,267 |
0.10% | 0 |
| James Bo Gritz | Cyril Minett | Populist |
3,577 |
0.07% | 0 |
| Dr. John Hagelin | Dr. V. Tompkins | Natural Law |
2,751 |
0.05% | 0 |
| James Warren | Willie Mae Reid | Soc. Workers |
1,361 |
0.03% | 0 |
| Write-ins | - | - |
17 |
0.00% | 0 |
| J. Quinn Brisben | - | Write-in |
4 |
0.00% | 0 |
| Lyndon LaRouche Jr. | - | Write-in |
1 |
0.00% | 0 |
 |
Map Key
| Turnout
 |  |  |
|
| Maps | 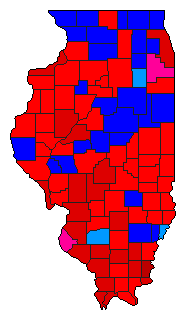 |  |  | | Pop. (m) | | Dem. (m) | | Rep. (m) | | Ind. (m) | | Swg (m) | | Tnd (m) |
| |
| Demographic Data
| 2000 Population: | 12,419,293 | Enum. | 2000 Population Density: | 86.3 | persons/km2 | | 1992 Population: | 11,694,184 | Est. | 1992 Population Density: | 81.2 | persons/km2 | | 1990 Population: | 11,430,602 | Enum. | 1990 Population Density: | 79.4 | persons/km2 | | Total Electoral Vote: | 22 | | Electoral Vote Density: | 531,554 | persons/EV | | Land Area (2000): | 143,961 | km2 | Annual Pop Growth Rate: | 0.8 | % |
| Election Data and Statistics:
| Election Tools
- Atlas Forum Image Code for Maps: County, Pop, Tnd, Swg
Data Sources:
- Source for Popular Vote data: Illinois State Board of Elections, comp., State of Illinois Official Vote Cast at the General Election of November 3, 1992 (Springfield, 1992)
- Source for Population data: U.S. Census Bureau.
| Results for and Individual County:
|
|
| |


