Home
2024
Election Results
Election Info
Weblog
Forum
Wiki
Search
Email
Login
Site Info
Store
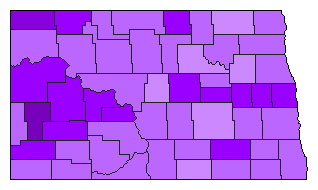
1992 Presidential Democratic Primary Election Results - North Dakota
Note: The Google advertisement links below may advocate political positions that this site does not endorse.
Presidential
Candidate
Home State
Political
Party
Caucus Result
Delegates
William J. Clinton
Arkansas
Democratic
2,300
47.08%
0
0.0%
Uncommitted
-
Democratic
1,295
26.51%
0
0.0%
Paul E. Tsongas
Massachusetts
Democratic
515
10.54%
0
0.0%
Edmund G. Brown
California
Democratic
375
7.68%
0
0.0%
Robert Kerrey
Nebraska
Democratic
340
6.96%
0
0.0%
Tom Harkin
Iowa
Democratic
60
1.23%
0
0.0%
Map Key
> 40%
> 50%
> 60%
> 70%
Turnout
Election Information:
Contest Type:
Party-run Caucus/Convention
Caucus Date:
1992-03-19
Eligible Participants:
Closed (only members of the party)
Delegates Awarded in this Contest:
0
Delegates Total:
0
Delegate Allocation Method:
Statewide Winner-take-all
Demographic Data
2000 Population:
642,200
Enum.
2000 Population Density:
3.6
persons/km
2
1992 Population:
638,223
Est.
1992 Population Density:
3.6
persons/km
2
1990 Population:
638,800
Enum.
1990 Population Density:
3.6
persons/km
2
Total Delegates:
0
Delegates Density:
persons/Del
Land Area (2000):
178,647
km
2
Annual Pop Growth Rate:
0.1
%
Election Data and Statistics:
Purchase Detailed Data
Data Sources:
Source for Popular Vote data:
Source for Population data: U.S. Census Bureau.
Presidential
Candidate
Home State
Political
Party
Primary Vote
Delegates
H. Ross Perot
-
Write-in
9,516
29.02%
0
0.0%
Lyndon H. La Rouche, Jr.
Virginia
Democratic
7,003
21.36%
0
0.0%
Charles Woods
Nevada
Democratic
6,641
20.26%
0
0.0%
Tom Shiekman
Florida
Democratic
4,866
14.84%
0
0.0%
William J. Clinton
Arkansas
Democratic
4,760
14.52%
0
0.0%
Map Key
> 40%
> 50%
> 60%
> 70%
Turnout
Maps
Pop. (m)
Wri. (m)
Dem. (m)
Dem. (m)
Dem. (m)
Dem. (m)
Election Information:
Contest Type:
State-run Primary
Election Date:
1992-06-09
Eligible Participants:
Closed (only members of the party)
Delegates Awarded in this Contest:
0
Delegates Total:
0
Delegate Allocation Method:
Statewide Winner-take-all
Demographic Data
2000 Population:
642,200
Enum.
2000 Population Density:
3.6
persons/km
2
1992 Population:
638,223
Est.
1992 Population Density:
3.6
persons/km
2
1990 Population:
638,800
Enum.
1990 Population Density:
3.6
persons/km
2
Total Delegates:
0
Delegates Density:
persons/Del
Land Area (2000):
178,647
km
2
Annual Pop Growth Rate:
0.1
%
Election Data and Statistics:
County Data (Table)
(m)
County Data (Graphs)
Purchase Detailed Data
Compare State Maps by Year
View All 1992 North Dakota Maps
Election Tools
1992 Democratic Primary Timeline
Atlas Forum
Image Code for Maps:
County
,
Pop
Data Sources:
Source for Popular Vote data:
Source for Population data: U.S. Census Bureau.
Results for and Individual County:
(m)
Choose Year
2020
2016
2016
2008
2004
2000
Choose Office
Choose Party
Republican
Choose State
Alabama
Alaska
American Samoa
Arizona
Arkansas
California
Colorado
Connecticut
Delaware
District of Columbia
Florida
Georgia
Guam
Hawaii
Idaho
Idaho
Illinois
Indiana
Iowa
Kansas
Kentucky
Louisiana
Maine
Maryland
Massachusetts
Michigan
Minnesota
Minnesota
Mississippi
Missouri
Montana
Nebraska
Nevada
New Hampshire
New Jersey
New Mexico
New York
North Carolina
Ohio
Oklahoma
Oregon
Pennsylvania
Puerto Rico
Rhode Island
South Carolina
South Dakota
Tennessee
Texas
Texas
Utah
Vermont
Virgin Islands
Virginia
Washington
Washington
West Virginia
Wisconsin
Wyoming
2000 >
North Dakota Election Results Home
-
National Results for 1992
-
Use Frame Navigation
Login
Terms of Use
-
DCMA Policy
-
Privacy Policy and Cookies
©
Dave Leip's Atlas of U.S. Elections, LLC 2019 All Rights Reserved


