| |
Presidential
Candidate | Vice Presidential
Candidate | Political
Party | Popular Vote | Electoral Vote |
 | William Clinton | Albert Gore Jr. | Democratic |
1,984,942 |
40.18% | 21 |
 | George Bush | J. Danforth Quayle | Republican |
1,894,310 |
38.35% | 0 |
 | H. Ross Perot | James Stockdale | Not Designated |
1,036,426 |
20.98% | 0 |
 | Andre Marrou | Nancy Lord | Not Designated |
7,252 |
0.15% | 0 |
| Lenore Fulani | Maria Munoz | Not Designated |
6,411 |
0.13% | 0 |
| James Bo Gritz | Cyril Minett | Not Designated |
4,698 |
0.10% | 0 |
| Dr. John Hagelin | Dr. V. Tompkins | Not Designated |
3,437 |
0.07% | 0 |
| Lyndon LaRouche Jr. | James Bevel | Not Designated |
2,446 |
0.05% | 0 |
| James Warren | Willie Mae Reid | Write-in |
32 |
0.00% | 0 |
| Write-ins | - | - |
10 |
0.00% | 0 |
 |
Map Key
| Turnout
 |  |  |
|
| Maps | 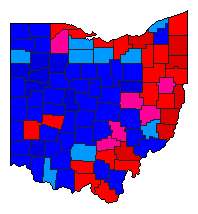 |  |  | | Pop. (m) | | Dem. (m) | | Rep. (m) | | Not. (m) | | Swg (m) | | Tnd (m) |
| |
| Demographic Data
| 2000 Population: | 11,353,140 | Enum. | 2000 Population Density: | 107.0 | persons/km2 | | 1992 Population: | 11,029,431 | Est. | 1992 Population Density: | 104.0 | persons/km2 | | 1990 Population: | 10,847,115 | Enum. | 1990 Population Density: | 102.3 | persons/km2 | | Total Electoral Vote: | 21 | | Electoral Vote Density: | 525,211 | persons/EV | | Land Area (2000): | 106,056 | km2 | Annual Pop Growth Rate: | 0.5 | % |
| Election Data and Statistics:
| Election Tools
- Atlas Forum Image Code for Maps: County, Pop, Tnd, Swg
Data Sources:
- Source for Popular Vote data: Ohio Secretary of State, Ohio Election Statistics Election Statistics for 1991-1992 (Cleveland, 1993)
- Source for Population data: U.S. Census Bureau.
| Results for and Individual County:
|
|
| |


