| |
Gubernatorial
Candidate | Lt. Gubernatorial
Candidate | Political
Party | Popular Vote |
 | Michael Leavitt | Olene S. Walker | Republican |
321,713 |
42.19% |
 | Merrill Cook | Frances Hatch Merrill | Independent |
255,753 |
33.54% |
 | Stewart Hanson | Paula F. Julander | Democratic |
177,181 |
23.24% |
 | Rita Gum | C. Samuel West | Populist |
3,593 |
0.47% |
| Gary R. Van Horn | Arly Hess Pedersen | American |
1,492 |
0.20% |
| Eleanor Garcia | William Arth | Socialist Workers |
1,158 |
0.15% |
| Linda Metzger-Agin | Gene Metzger-Agin | - |
917 |
0.12% |
| Frank W. Richins | - | Independent American |
729 |
0.10% |
 |
Map Key
| Turnout
 |  |
|
| Maps | 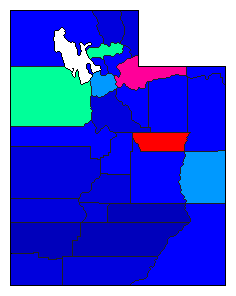 |  | | Pop. (m) | | Rep. (m) | | Ind. (m) | | Dem. (m) |
| |
| Demographic Data
| 2000 Population: | 2,233,169 | Enum. | 2000 Population Density: | 10.5 | persons/km2 | | 1992 Population: | 1,836,799 | Est. | 1992 Population Density: | 8.6 | persons/km2 | | 1990 Population: | 1,722,850 | Enum. | 1990 Population Density: | 8.1 | persons/km2 | | Land Area (2000): | 212,751 | km2 | Annual Pop Growth Rate: | 2.6 | % |
| Election Data and Statistics:
| Election Tools
- Atlas Forum Image Code for Maps: County, Pop
Data Sources:
- Source for Popular Vote data: Utah State Elections Office, (Salt Lake City, 1992)
- Source for Population data: U.S. Census Bureau.
| Results for and Individual County:
|
|
| |


