Home
2024
Election Results
Election Info
Weblog
Forum
Wiki
Search
Email
Login
Site Info
Store
1994 Gubernatorial General Election Results - California
Note: The Google advertisement links below may advocate political positions that this site does not endorse.
Gubernatorial
Candidate
Political
Party
Popular Vote
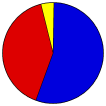
Pete Wilson
Republican
4,781,766
55.18%
Kathleen Brown
Democratic
3,519,799
40.62%
Richard Rider
Libertarian
149,281
1.72%
Jerome McCready
American Independent
133,870
1.54%
Gloria Estela La Riva
Peace & Freedom
80,440
0.93%
Write-ins
-
219
0.00%
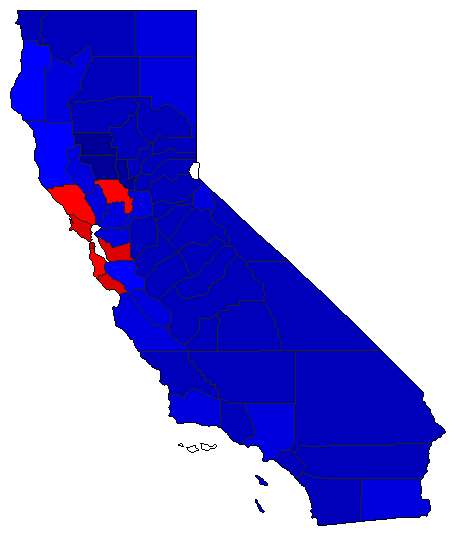
Map Key
> 40%
> 50%
> 60%
> 70%
Turnout
Maps
Pop. (m)
Rep. (m)
Dem. (m)
Swg (m)
Tnd (m)
Demographic Data
2000 Population:
33,871,648
Enum.
2000 Population Density:
83.9
persons/km
2
1994 Population:
31,484,435
Est.
1994 Population Density:
77.9
persons/km
2
1990 Population:
29,785,857
Enum.
1990 Population Density:
73.7
persons/km
2
Land Area (2000):
403,933
km
2
Annual Pop Growth Rate:
1.3
%
Election Data and Statistics:
County Data (Table)
(m)
County Data (Graphs)
Purchase Detailed Data
Compare State Data by Year (Table)
Compare State Data by Year (Graphs)
View All 1994 California Data
Compare State Maps by Year
View All 1994 California Maps
Election Tools
Atlas Forum
Image Code for Maps:
County
,
Pop
,
Tnd
,
Swg
Data Sources:
Source for Popular Vote data: California Secretary of State, comp., "Governor,"
Statement of Vote November 8, 1994, General Election
(Sacramento, 1994)
Source for Population data: U.S. Census Bureau.
Results for and Individual County:
(m)
< 1990
Choose Year
2022
2021
2018
2014
2010
2006
2003
2002
1998
1990
1986
1982
1978
1974
1970
1966
1962
1958
1954
1950
1946
1942
1938
1934
1930
1926
1922
1918
1914
1910
1906
1902
1898
1894
1890
1886
1882
1879
1875
1871
1867
1863
1861
1859
1857
1855
1853
1851
1849
Choose Office
Senator
Lt. Governor
Secretary of State
State Treasurer
Attorney General
Controller
Insurance Commissioner
Proposition 187
Proposition 186, Single-Payer Healthcare System Initiative
Choose State
Alabama
Alaska
Arizona
Arkansas
Colorado
Connecticut
Florida
Georgia
Hawaii
Idaho
Illinois
Iowa
Kansas
Maine
Maryland
Massachusetts
Michigan
Minnesota
Nebraska
Nevada
New Hampshire
New Mexico
New York
Ohio
Oklahoma
Oregon
Pennsylvania
Rhode Island
South Carolina
South Dakota
Tennessee
Texas
Vermont
Wisconsin
Wyoming
1998 >
California Election Results Home
-
National Results for 1994
-
Use Frame Navigation
Login
Terms of Use
-
DCMA Policy
-
Privacy Policy and Cookies
©
Dave Leip's Atlas of U.S. Elections, LLC 2019 All Rights Reserved


