| |
Senatorial
Candidate | Political
Party | Popular Vote |
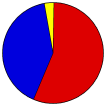
 | Richard J. Durbin | Democratic |
2,384,028 |
56.09% |
 | Al Salvi | Republican |
1,728,824 |
40.67% |
 | Steven H. Perry | Reform |
61,023 |
1.44% |
| Robin J. Miller | Libertarian |
41,218 |
0.97% |
| Chad Koppie | U.S. Taxpayers |
17,563 |
0.41% |
| James E. Davis | Natural Law |
13,838 |
0.33% |
| Robert A. Rudner | Write-in |
4,222 |
0.10% |
| Steve Dahl | Write-in |
6 |
0.00% |
 |
Map Key
| Turnout
 |  |
|
| Maps | 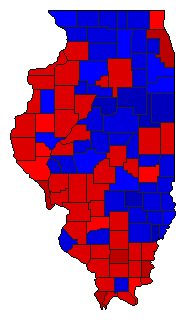 |  |  | | Pop. (m) | | Dem. (m) | | Rep. (m) | | Swg (m) | | Tnd (m) |
| |
| Demographic Data
| 2000 Population: | 12,419,293 | Enum. | 2000 Population Density: | 86.3 | persons/km2 | | 1996 Population: | 12,101,997 | Est. | 1996 Population Density: | 84.1 | persons/km2 | | 1990 Population: | 11,430,602 | Enum. | 1990 Population Density: | 79.4 | persons/km2 | | Land Area (2000): | 143,961 | km2 | Annual Pop Growth Rate: | 0.8 | % |
| Election Data and Statistics:
| Election Tools
- Atlas Forum Image Code for Maps: County, Pop, Tnd, Swg
Data Sources:
- Source for Popular Vote data: Illinois State Board of Elections, "United States Senator," State of Illinois Official Vote Cast at the General Election November 5, 1996 (Springfield, 1996)
- Source for Population data: U.S. Census Bureau.
| Results for and Individual County:
|
|
| |


