| |
Senatorial
Candidate | Political
Party | Popular Vote |
 | Pat Roberts | Republican |
652,677 |
62.02% |
 | Sally Thompson | Democratic |
362,380 |
34.44% |
 | Mark S. Marney | Reform |
24,145 |
2.29% |
| Steven Rosile | Libertarian |
13,098 |
1.24% |
 |
Map Key
| > 40% |
 |
 |
| > 50% |
|
 |
| > 60% |
 |
 |
| > 70% |
|
 |
| > 80% |
|
 |
| Turnout
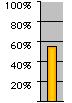 |  |
|
| Maps | 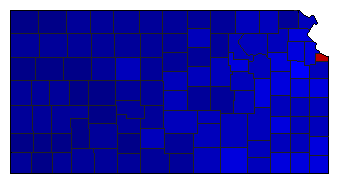 |  |  | | Pop. (m) | | Rep. (m) | | Dem. (m) | | Swg (m) | | Tnd (m) |
| |
| Demographic Data
| 2000 Population: | 2,688,418 | Enum. | 2000 Population Density: | 12.7 | persons/km2 | | 1996 Population: | 2,614,554 | Est. | 1996 Population Density: | 12.3 | persons/km2 | | 1990 Population: | 2,477,588 | Enum. | 1990 Population Density: | 11.7 | persons/km2 | | Land Area (2000): | 211,900 | km2 | Annual Pop Growth Rate: | 0.8 | % |
| Election Data and Statistics:
| Election Tools
- Atlas Forum Image Code for Maps: County, Pop, Tnd, Swg
Data Sources:
- Source for Popular Vote data: Kansas Secretary of State. Division of Elections and Legislative Matters. United States Senate, Kansas Secretary of State. Division of Elections and Legislative Matters (
) (accessed 12 May 2006)
- Source for Population data: U.S. Census Bureau.
| Results for and Individual County:
|
|
| |


