| |
Presidential
Candidate | Vice Presidential
Candidate | Political
Party | Popular Vote | Electoral Vote |
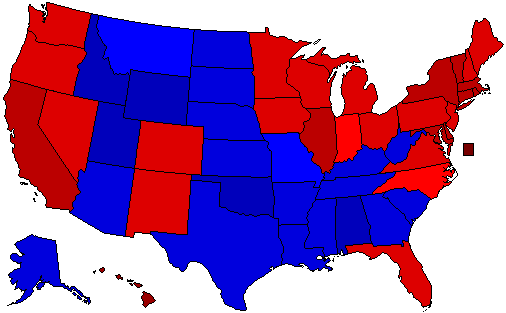
 | Barack H. Obama | Joseph R. Biden, Jr. | Democratic |
69,499,428 |
52.86% | 69,499,428 |
 | John S. McCain, III | Sarah H. Palin | Republican |
59,950,323 |
45.60% | 59,950,323 |
 | Ralph Nader | Matt Gonzalez | Independent |
739,278 |
0.56% | 739,278 |
| Bob Barr | Wayne Allyn Root | Libertarian |
523,433 |
0.40% | 523,433 |
| Write-ins | - | - |
263,921 |
0.20% | 263,921 |
| Charles O. Baldwin | Darrell L. Castle | Constitution |
199,880 |
0.15% | 199,880 |
| Cynthia A. McKinney | Rosa A. Clemente | Green |
161,870 |
0.12% | 161,870 |
| Alan Keyes | Wiley S. Drake, Sr. | Independent |
47,941 |
0.04% | 47,941 |
| Ron Paul | Barry Goldwater, Jr. | LA Taxpayers |
47,512 |
0.04% | 47,512 |
| Róger Calero | Alyson Kennedy | Socialist Workers |
7,577 |
0.01% | 7,577 |
| Gloria La Riva | Eugene Puryear | Socialism and Liberation |
6,821 |
0.01% | 6,821 |
| Brian Moore | Stewart A. Alexander | Socialist |
6,582 |
0.01% | 6,582 |
| None of these Candidates | - | - |
6,407 |
0.00% | 6,407 |
| Richard Duncan | Ricky Johnson | Independent |
3,905 |
0.00% | 3,905 |
| Charles Jay | Tom Knapp | Boston Tea Party |
2,425 |
0.00% | 2,425 |
| John Joseph Polachek | - | New |
1,149 |
0.00% | 1,149 |
| Frank E. McEnulty | David Mangan | New American Indpendent |
833 |
0.00% | 833 |
| Jeffrey J. Wamboldt | David J. Klimisch | We, the People |
764 |
0.00% | 764 |
| Thomas R. Stevens | Alden Link | Objectivist |
755 |
0.00% | 755 |
| Gene C. Amondson | Leroy J. Pletten | Prohibition |
655 |
0.00% | 655 |
| Jeffrey Boss | - | Vote Here |
639 |
0.00% | 639 |
| George D. J. Phillies | Chris Bennett | Libertarian |
531 |
0.00% | 531 |
| Jonathan E. Allen | Jeffrey D. Stath | Independent |
484 |
0.00% | 484 |
| Ted C. Weill | Frank McEnulty | Reform |
481 |
0.00% | 481 |
| Bradford Lyttle | - | US Pacifist |
111 |
0.00% | 111 |
 |
Map Key
| > 40% |
 |
 |
| > 50% |
 |
 |
| > 60% |
 |
 |
| > 70% |
 |
 |
| > 90% |
 |
|
| Turnout
 |  |  |
|
|
| Demographic Data
| 2010 Population: | 308,745,538 | Enum. | 2010 Population Density: | 33.7 | persons/km2 | | 2008 Population: | 304,059,724 | Est. | 2008 Population Density: | 33.2 | persons/km2 | | 2000 Population: | 281,422,053 | Enum. | 2000 Population Density: | 30.7 | persons/km2 | | Total Electoral Vote: | 131473705 | | Electoral Vote Density: | 2 | persons/EV | | Land Area (2000): | 9,161,889 | km2 | Annual Pop Growth Rate: | 0.9 | % |
| Election Data and Statistics:
| Election Tools
- Atlas Forum Image Code for Maps: County, Town, Pop, Tnd, Swg
Data Sources:
- Source for Popular Vote data:
- Source for Population data: U.S. Census Bureau.
| Results for and Individual :
| Primary Documentation:
- 2008 Certificate of Ascertainment (m)
- 2008 Certificate of Vote (m)
|
| The 2008 Campaign:
|
|
| |
|


