Home
2024
Election Results
Election Info
Weblog
Forum
Wiki
Search
Email
Login
Site Info
Store
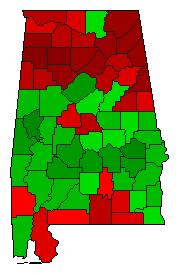
2008 Presidential Democratic Primary Election Results
Note: The Google advertisement links below may advocate political positions that this site does not endorse.
Presidential
Candidate
Home State
Political
Party
Primary Vote
Delegates
Barack Obama
Illinois
Democratic
300,321
55.96%
27
45.0%
Hillary Clinton
New York
Democratic
223,096
41.57%
25
41.7%
John Edwards
North Carolina
Democratic
7,841
1.46%
0
0.0%
Uncommitted
-
Democratic
2,663
0.50%
0
0.0%
Other (
+
)
-
Democratic
2,714
0.51%
0
0%
Unallocated
-
Democratic
-
-
8
13.3%
Map Key
> 40%
> 50%
> 60%
> 70%
> 80%
Turnout
Maps
Election Information:
Contest Type:
State-run Primary
Election Date:
2008-02-05
Eligible Participants:
Open (all voters)
Delegates Awarded in this Contest:
52
Delegates Total:
60
Delegate Allocation Method:
Proportional - the candidates are awarded delegates in proportion to the percentage of votes received. A 15% threshold is required to receive delegates.
18 at-large delegates
34 district delegates
8 unpledged delegates
Congressional District 1: 4 delegates
Congressional District 2: 4 delegates
Congressional District 3: 5 delegates
Congressional District 4: 5 delegates
Congressional District 5: 5 delegates
Congressional District 6: 4 delegates
Congressional District 7: 7 delegates
Demographic Data
2010 Population:
4,779,736
Enum.
2010 Population Density:
36.4
persons/km
2
2008 Population:
4,718,206
Est.
2008 Population Density:
35.9
persons/km
2
2000 Population:
4,447,100
Enum.
2000 Population Density:
33.8
persons/km
2
Total Delegates:
60.0
Delegates Density:
78,637
persons/Del
Land Area (2000):
131,426
km
2
Annual Pop Growth Rate:
0.7
%
Election Data and Statistics:
County Data (Table)
(m)
County Data (Graphs)
Purchase Detailed Data
Compare State Maps by Year
View All 2008 Alabama Maps
Election Tools
2008 Democratic Primary Timeline
Atlas Forum
Image Code for Maps:
County
,
Pop
Data Sources:
Source for Popular Vote data:
Source for Population data: U.S. Census Bureau.
Results for and Individual County:
Autauga County
Baldwin County
Barbour County
Bibb County
Blount County
Bullock County
Butler County
Calhoun County
Chambers County
Cherokee County
Chilton County
Choctaw County
Clarke County
Clay County
Cleburne County
Coffee County
Colbert County
Conecuh County
Coosa County
Covington County
Crenshaw County
Cullman County
Dale County
Dallas County
DeKalb County
Elmore County
Escambia County
Etowah County
Fayette County
Franklin County
Geneva County
Greene County
Hale County
Henry County
Houston County
Jackson County
Jefferson County
Lamar County
Lauderdale County
Lawrence County
Lee County
Limestone County
Lowndes County
Macon County
Madison County
Marengo County
Marion County
Marshall County
Mobile County
Monroe County
Montgomery County
Morgan County
Perry County
Pickens County
Pike County
Randolph County
Russell County
St. Clair County
Shelby County
Sumter County
Talladega County
Tallapoosa County
Tuscaloosa County
Walker County
Washington County
Wilcox County
Winston County
< 2004
Choose Year
2020
2016
2004
2000
1992
Choose Office
Senator
Choose Party
Republican
Choose State
Alaska
American Samoa
Arizona
Arkansas
California
Colorado
Colorado
Connecticut
Delaware
District of Columbia
Florida
Georgia
Guam
Hawaii
Idaho
Idaho
Illinois
Indiana
Iowa
Iowa
Kansas
Kentucky
Louisiana
Maine
Maryland
Massachusetts
Michigan
Minnesota
Mississippi
Missouri
Montana
Nebraska
Nebraska
Nevada
Nevada
New Hampshire
New Jersey
New Mexico
New York
North Carolina
North Dakota
Ohio
Oklahoma
Oregon
Pennsylvania
Puerto Rico
Rhode Island
South Carolina
South Dakota
Tennessee
Texas
Texas
Texas
Utah
Vermont
Virgin Islands
Virginia
Washington
Washington
West Virginia
Wisconsin
Wyoming
2016 >
Alabama Election Results Home
-
National Results for 2008
-
Use Frame Navigation
Login
Terms of Use
-
DCMA Policy
-
Privacy Policy and Cookies
©
Dave Leip's Atlas of U.S. Elections, LLC 2019 All Rights Reserved


