Home
2024
Election Results
Election Info
Weblog
Forum
Wiki
Search
Email
Login
Site Info
Store
2008 Presidential General Election Results
Note: The Google advertisement links below may advocate political positions that this site does not endorse.
Presidential
Candidate
Vice Presidential
Candidate
Political
Party
Popular Vote
Electoral Vote
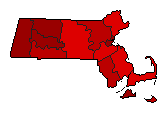
Barack H. Obama
Joseph R. Biden, Jr.
Democratic
1,904,098
61.80%
12
John S. McCain, III
Sarah Palin
Republican
1,108,854
35.99%
0
Ralph Nader
Matt Gonzalez
Independent
28,841
0.94%
0
Write-ins
-
-
14,566
0.47%
0
Bob Barr
Wayne A. Root
Libertarian
13,189
0.43%
0
Other (
+
)
-
-
11,521
0.37%
0
Map Key
> 40%
> 50%
> 60%
> 70%
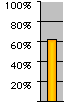
Turnout
Maps
Election Notes:
Results include one vote added for Obama in City of Boston (Suffolk County) per Boston City Elections
Results include 83 votes added for write-ins in Town of Barnstable (Barnstable County) per town Elections
Demographic Data
2010 Population:
6,547,629
Enum.
2010 Population Density:
322.4
persons/km
2
2008 Population:
6,468,967
Est.
2008 Population Density:
318.6
persons/km
2
2000 Population:
6,349,097
Enum.
2000 Population Density:
312.7
persons/km
2
Total Electoral Vote:
12
Electoral Vote Density:
539,081
persons/EV
Land Area (2000):
20,306
km
2
Annual Pop Growth Rate:
0.3
%
Election Data and Statistics:
County Data (Table)
(m)
County Data (Graphs)
Congressional District Data
(m)
City and Town Data
(m)
Purchase Detailed Data
Compare State Data by Year (Table)
Compare State Data by Year (Graphs)
View All 2008 Massachusetts Data
Compare State Maps by Year
View All 2008 Massachusetts Maps
Massachusetts JavaCompare
(m)
Election Tools
Atlas Forum
Image Code for Maps:
County
,
CD
,
Town
,
Pop
,
Tnd
,
Swg
Data Sources:
Source for Popular Vote data: Massachusetts Secretary of the Commonwealth. Elections Division.
0
, Massachusetts Secretary of the Commonwealth. Elections Division ( ) (accessed 0)
Source for Population data: U.S. Census Bureau.
Results for and Individual County:
Barnstable County
Berkshire County
Bristol County
Dukes County
Essex County
Franklin County
Hampden County
Hampshire County
Middlesex County
Nantucket County
Norfolk County
Plymouth County
Suffolk County
Worcester County
Primary Documentation:
2008 Certificate of Ascertainment
(m)
2008 Certificate of Vote
(m)
2008 Official County Documents
The 2008 Campaign:
General Election Candidates
Pre-Election Polls
< 2004
Choose Year
2020
2016
2012
2004
2000
1996
1992
1988
1984
1980
1976
1972
1968
1964
1960
1956
1952
1948
1944
1940
1936
1932
1928
1924
1920
1916
1912
1908
1904
1900
1896
1892
1888
1884
1880
1876
1872
1868
1864
1860
1856
1852
1848
1844
1840
1836
1832
1828
1824
Choose Office
Senator
Choose State
Alabama
Alaska
Arizona
Arkansas
California
Colorado
Connecticut
Delaware
District of Columbia
Florida
Georgia
Hawaii
Idaho
Illinois
Indiana
Iowa
Kansas
Kentucky
Louisiana
Maine
Maryland
Michigan
Minnesota
Mississippi
Missouri
Montana
Nebraska
Nevada
New Hampshire
New Jersey
New Mexico
New York
North Carolina
North Dakota
Ohio
Oklahoma
Oregon
Pennsylvania
Rhode Island
South Carolina
South Dakota
Tennessee
Texas
Utah
Vermont
Virginia
Washington
West Virginia
Wisconsin
Wyoming
2012 >
Massachusetts Election Results Home
-
National Results for 2008
-
Use Frame Navigation
Login
Terms of Use
-
DCMA Policy
-
Privacy Policy and Cookies
©
Dave Leip's Atlas of U.S. Elections, LLC 2019 All Rights Reserved


