Home
2024
Election Results
Election Info
Weblog
Forum
Wiki
Search
Email
Login
Site Info
Store
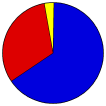
2008 Senatorial General Election Results
Note: The Google advertisement links below may advocate political positions that this site does not endorse.
Senatorial
Candidate
Political
Party
Popular Vote
Lamar Alexander
Republican
1,579,477
65.14%
Bob Tuke
Democratic
767,236
31.64%
Edward L. Buck
Independent
31,631
1.30%
Christopher G. Fenner
Independent
11,073
0.46%
Daniel T. Lewis
Libertarian
9,367
0.39%
Chris Lugo
Independent
9,170
0.38%
Ed Lawhorn
Independent
8,986
0.37%
David Gatchell
Independent
7,645
0.32%
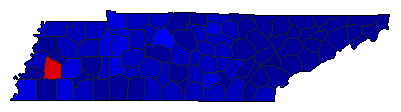
Map Key
> 40%
> 50%
> 60%
> 70%
> 80%
Turnout
Maps
Demographic Data
2010 Population:
6,346,105
Enum.
2010 Population Density:
59.4
persons/km
2
2008 Population:
6,247,411
Est.
2008 Population Density:
58.5
persons/km
2
2000 Population:
5,689,283
Enum.
2000 Population Density:
53.3
persons/km
2
Land Area (2000):
106,752
km
2
Annual Pop Growth Rate:
1.1
%
Election Data and Statistics:
County Data (Table)
(m)
County Data (Graphs)
Purchase Detailed Data
Compare State Data by Year (Table)
Compare State Data by Year (Graphs)
View All 2008 Tennessee Data
Compare State Maps by Year
View All 2008 Tennessee Maps
Election Tools
Atlas Forum
Image Code for Maps:
County
,
Pop
,
Tnd
,
Swg
Data Sources:
Source for Popular Vote data: Tennessee Secretary of State. Division of Elections.
State of Tennessee November 4, 2008 General Election United States Senate
, Tennessee Secretary of State. Division of Elections ( ) (accessed 15 Dec 2008)
Source for Population data: U.S. Census Bureau.
Results for and Individual County:
Anderson County
Bedford County
Benton County
Bledsoe County
Blount County
Bradley County
Campbell County
Cannon County
Carroll County
Carter County
Cheatham County
Chester County
Claiborne County
Clay County
Cocke County
Coffee County
Crockett County
Cumberland County
Davidson County
Decatur County
DeKalb County
Dickson County
Dyer County
Fayette County
Fentress County
Franklin County
Gibson County
Giles County
Grainger County
Greene County
Grundy County
Hamblen County
Hamilton County
Hancock County
Hardeman County
Hardin County
Hawkins County
Haywood County
Henderson County
Henry County
Hickman County
Houston County
Humphreys County
Jackson County
Jefferson County
Johnson County
Knox County
Lake County
Lauderdale County
Lawrence County
Lewis County
Lincoln County
Loudon County
McMinn County
McNairy County
Macon County
Madison County
Marion County
Marshall County
Maury County
Meigs County
Monroe County
Montgomery County
Moore County
Morgan County
Obion County
Overton County
Perry County
Pickett County
Polk County
Putnam County
Rhea County
Roane County
Robertson County
Rutherford County
Scott County
Sequatchie County
Sevier County
Shelby County
Smith County
Stewart County
Sullivan County
Sumner County
Tipton County
Trousdale County
Unicoi County
Union County
Van Buren County
Warren County
Washington County
Wayne County
Weakley County
White County
Williamson County
Wilson County
The 2008 Campaign:
Pre-Election Polls
< 2006
Choose Year
2020
2018
2014
2012
2006
2002
2000
1996
1994
1994
1990
1988
1982
1964
Choose Office
President
Choose State
Alabama Class 2
Alaska Class 2
Arkansas Class 2
Colorado Class 2
Delaware Class 2
Georgia Class 2
Idaho Class 2
Illinois Class 2
Iowa Class 2
Kansas Class 2
Kentucky Class 2
Louisiana Class 2
Maine Class 2
Massachusetts Class 2
Michigan Class 2
Minnesota Class 2
Mississippi Class 1
Mississippi Class 2
Montana Class 2
Nebraska Class 2
New Hampshire Class 2
New Jersey Class 2
New Mexico Class 2
North Carolina Class 2
Oklahoma Class 2
Oregon Class 2
Rhode Island Class 2
South Carolina Class 2
South Dakota Class 2
Texas Class 2
Virginia Class 2
West Virginia Class 2
Wyoming Class 1
Wyoming Class 2
District of Columbia
2012 >
Tennessee Election Results Home
-
National Results for 2008
-
Use Frame Navigation
Login
Terms of Use
-
DCMA Policy
-
Privacy Policy and Cookies
©
Dave Leip's Atlas of U.S. Elections, LLC 2019 All Rights Reserved


