| |
Gubernatorial
Candidate | Political
Party | Popular Vote |
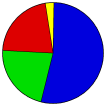
 | Jim Douglas | Republican |
170,492 |
53.43% |
 | Anthony Pollina | Independent |
69,791 |
21.87% |
 | Gaye Symington | Democratic |
69,534 |
21.79% |
 | Tony O'Connor | Cheap Renewable Energy |
3,106 |
0.97% |
| Sam Young | Independent |
2,490 |
0.78% |
| Peter Diamondstone | Liberty Union |
1,710 |
0.54% |
| Chris Ericson | Independent |
1,704 |
0.53% |
| Write-ins | Write-ins |
258 |
0.08% |
 |
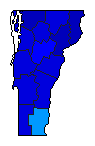
Map Key
| Turnout
 |  |
|
|
| Demographic Data
| 2010 Population: | 625,741 | Enum. | 2010 Population Density: | 26.1 | persons/km2 | | 2008 Population: | 624,151 | Est. | 2008 Population Density: | 26.1 | persons/km2 | | 2000 Population: | 608,827 | Enum. | 2000 Population Density: | 25.4 | persons/km2 | | Land Area (2000): | 23,956 | km2 | Annual Pop Growth Rate: | 0.3 | % |
| Election Data and Statistics:
| Election Tools
- Atlas Forum Image Code for Maps: County, Town, Pop, Tnd, Swg
Data Sources:
- Source for Popular Vote data: Vermont Office of the Secretary of State. Detailed Results 2008 General Election For Governor, Vermont Office of the Secretary of State (
) (accessed 14 Nov 2008)
- Source for Population data: U.S. Census Bureau.
| Results for and Individual County:
|
| The 2008 Campaign:
|
|
| |


