Note: The Google advertisement links below may advocate political positions that this site does not endorse.
Data for this Contest was Contributed by on 2010-12-03
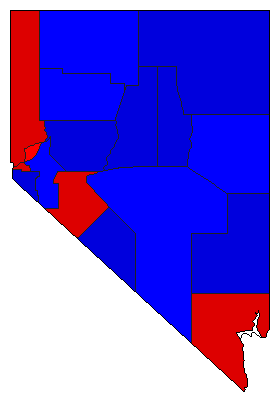
* Unofficial Results *

  Secretary of State
Candidate
Political
Party
Popular Vote
Ross MillerDemocratic 374,086 53.17%
Rob LauerRepublican 262,222 37.27%
John WagnerIndependent American 42,178 6.00%
None of these Candidates- 25,027 3.56%
State Seal Map Key
 > 40%
 > 50%
 > 60%
 > 70%
Turnout
Voter Turnout Graph
Vote Pie Chart
Maps
  2010 Nevada County Map of General Election Results for Secretary of State  
County Button
Pop Button
Per Vote Democratic Button
Per Vote Republican Button
Per Vote Independent American Button
 
Demographic Data

2010 Population:2,700,551Enum.2010 Population Density:9.5persons/km2
2000 Population:1,998,257Enum.2000 Population Density:7.0persons/km2
Land Area (2000):284,448km2Annual Pop Growth Rate:3.1%

Election Data and Statistics:
Election Tools
Data Sources:
  • Source for Popular Vote data: Nevada Secretary of State. 2010 Unofficial Statewide General Election Results Summary, Nevada Secretary of State (http://www.nvsos.gov/soselectionpages/results/2010STatewideGeneral/ElectionSummary.aspx) (accessed 03 Dec 2010)
  • Source for Population data: U.S. Census Bureau.
Results for and Individual County:


Churchill County Clark County Douglas County Elko County Esmeralda County Eureka County Humboldt County Lander County Lincoln County Lyon County Mineral County Nye County Pershing County Storey County Washoe County White Pine County Carson City City