| |
Presidential
Candidate | Vice Presidential
Candidate | Political
Party | Popular Vote | Electoral Vote |
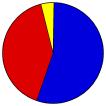
 | Willard Mitt Romney | Paul Ryan | Republican |
164,676 |
54.80% | 3 |
 | Barack H. Obama | Joseph R. Biden, Jr. | Democratic |
122,640 |
40.81% | 0 |
 | Gary Johnson | James P. Gray | Libertarian |
7,392 |
2.46% | 0 |
| Jill Stein | Cheri Honkala | Green |
2,917 |
0.97% | 0 |
| Write-ins | - | - |
2,870 |
0.96% | 0 |
 |
Map Key
| Turnout
 |  |  |
| Demographic Data
| 2012 Population: | 730,810 | Est. | 2012 Population Density: | 0.5 | persons/km2 | | 2010 Population: | 710,231 | Enum. | 2010 Population Density: | 0.5 | persons/km2 | | Total Electoral Vote: | 3 | | Electoral Vote Density: | 243,603 | persons/EV | | Land Area (2000): | 1,481,347 | km2 | Annual Pop Growth Rate: | 1.4 | % |
| Election Data and Statistics:
| Election Tools
- Atlas Forum Image Code for Maps: County
Data Sources:
- Source for Popular Vote data: State of Alaska Division of Elections. Statement of Votes Cast - Official, State of Alaska Division of Elections (http://www.elections.alaska.gov/results/12GENR/index.shtml
) (accessed 28 Nov 2012)
- Source for Population data: U.S. Census Bureau.
| | Primary Documentation:
|
| The 2012 Campaign:
|
|
| |


