| |
Presidential
Candidate | Home State | Political
Party | Caucus Result | Delegates |
 | Mitt Romney | Massachusetts | Republican |
2,373 |
38.00% | 0 | 0.0% |
 | Ron Paul | Texas | Republican |
2,258 |
36.16% | 0 | 0.0% |
 | Rick Santorum | Virginia | Republican |
1,136 |
18.19% | 0 | 0.0% |
 | Newt Gingrich | Virginia | Republican |
405 |
6.49% | 0 | 0.0% |
 | Uncommitted | - | Republican |
60 |
0.96% | 0 | 0.0% |
| Other Candidates | - | Republican |
13 |
0.21% | 0 | 0.0% |
 | Unallocated | - | Republican |
- |
- | 24 | 100.0% |
 |
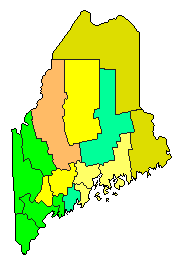
Map Key
| Turnout
 |  |  |
|
|
| | Election Information: | | Contest Type: | Party-run Caucus/Convention | | Caucus Date: | 2012-02-11 | | Eligible Participants: | Closed (only members of the party) | | Delegates Awarded in this Contest: | 0 | | Delegates Total: | 24 | | Statewide Delegates: Caucus and/or conventions - delegates are awarded through the Caucus and Convention system |
|
| Demographic Data
| 2012 Population: | 1,328,094 | Est. | 2012 Population Density: | 16.6 | persons/km2 | | 2010 Population: | 1,328,361 | Enum. | 2010 Population Density: | 16.6 | persons/km2 | | Total Delegates: | 24 | | Delegates Density: | 55,337 | persons/Del | | Land Area (2000): | 79,931 | km2 | Annual Pop Growth Rate: | -0.0 | % |
| Election Data and Statistics:
| Election Tools
|
| |


