Note: The Google advertisement links below may advocate political positions that this site does not endorse.
  Gubernatorial
Candidate
Lt. Gubernatorial
Candidate
Political
Party
Popular Vote
Chris ChristieKimberly M. GuadagnoRepublican 1,278,932 60.24%
Barbara BuonoMilly SilvaDemocratic 809,978 38.15%
Kenneth R. KaplanBrenda BellLibertarian 12,155 0.57%
Steven WelzerPatricia AlessandriniGreen 8,295 0.39%
YOther (+) - - 13,681 0.64%
State Seal Map Key
 > 40%
 > 50%
 > 60%
 > 70%
Turnout
Voter Turnout Graph
Vote Pie Chart
Maps
  2013 New Jersey County Map of General Election Results for Governor  
County Button
2000 Button
Pop Button
Town (m)
Per Vote Republican Button
Per Vote Democratic Button
Swing Map Button
Trend Map Button
 
Demographic Data

2013 Population:8,857,821Est.2013 Population Density:461.1persons/km2
2010 Population:8,791,894Enum.2010 Population Density:457.6persons/km2
Land Area (2000):19,211km2Annual Pop Growth Rate:0.2%

Election Data and Statistics:
Election Tools
Data Sources:
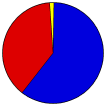
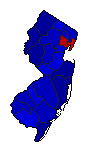
  • Source for Popular Vote data: New Jersey Department of Law and Public Safety. Division of Elections. Official List Candidates for Governor For General Election 11/05/2013 Election, New Jersey Department of Law and Public Safety. Division of Elections (http://nj.gov/state/elections/2013-results/2013-official-general-election-results-governor.pdf ) (accessed 04 Dec 2013)
  • Source for Population data: U.S. Census Bureau.
Results for and Individual County:
Primary Documentation:
The 2013 Campaign:


Atlantic County Bergen County Burlington County Camden County Cape May County Cumberland County Essex County Gloucester County Hudson County Hunterdon County Mercer County Middlesex County Monmouth County Morris County Ocean County Passaic County Salem County Somerset County Sussex County Union County Warren County