Note: The Google advertisement links below may advocate political positions that this site does not endorse.
  Gubernatorial
Candidate
Lt. Gubernatorial
Candidate
Political
Party
Popular Vote
Larry HoganBoyd RutherfordRepublican 884,400 51.03%
Anthony G. BrownKen UlmanDemocratic 818,890 47.25%
Shawn QuinnLorenzo GaztanagoLibertarian 25,382 1.46%
YOther (+) - - 4,505 0.26%
State Seal Map Key
 > 50%
 > 60%
 > 70%
 > 80%
Turnout
Voter Turnout Graph
Vote Pie Chart
Maps
  2014 Maryland County Map of General Election Results for Governor  
County Button
2000 Button
Pop Button
Per Vote Republican Button
Per Vote Democratic Button
Swing Map Button
Trend Map Button
 
Demographic Data

2014 Population:5,960,064Est.2014 Population Density:235.4persons/km2
2010 Population:5,773,552Enum.2010 Population Density:228.1persons/km2
Land Area (2000):25,314km2Annual Pop Growth Rate:0.8%

Election Data and Statistics:
Election Tools
Data Sources:
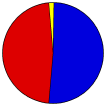
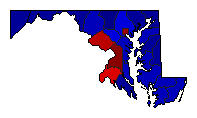
  • Source for Popular Vote data: Maryland State Board of Elections. Official 2014 Gubernatorial General Election results for Governor / Lt. Governor, Maryland State Board of Elections (http://elections.state.md.us/elections/2014/results/General/gen_detail_results_p2014_2_BOT003-.html ) (accessed 05 Dec 2014)
  • Source for Population data: U.S. Census Bureau.
Results for and Individual County:
The 2014 Campaign:


Allegany County Anne Arundel County Baltimore City Baltimore County Calvert County Caroline County Carroll County Cecil County Charles County Dorchester County Frederick County Garrett County Harford County Howard County Kent County Montgomery County Prince George's County Queen Anne's County St. Mary's County Somerset County Talbot County Washington County Wicomico County Worcester County