| |
Gubernatorial
Candidate | Political
Party | Popular Vote |
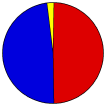
 | Democratic | Democratic |
46,301,180 |
50.37% |
 | Republican | Republican |
43,480,790 |
47.30% |
 | Libertarian | Libertarian |
877,842 |
0.96% |
| State1 | State1 |
430,037 |
0.47% |
| Independent | Independent |
299,520 |
0.33% |
| Green | Green |
296,490 |
0.32% |
| Constitution | Constitution |
62,902 |
0.07% |
| Reform | Reform |
47,140 |
0.05% |
| Write-ins | Write-ins |
43,057 |
0.05% |
| State2 | State2 |
27,614 |
0.03% |
| Independent American | Independent American |
10,076 |
0.01% |
| State3 | State3 |
9,968 |
0.01% |
| State25 | State25 |
4,687 |
0.01% |
| State23 | State23 |
3,631 |
0.00% |
| State15 | State15 |
2,969 |
0.00% |
| State24 | State24 |
2,444 |
0.00% |
| Lberty Union | Lberty Union |
1,839 |
0.00% |
| State16 | State16 |
1,550 |
0.00% |
| State7 | State7 |
1,516 |
0.00% |
| State18 | State18 |
1,396 |
0.00% |
| State4 | State4 |
1,156 |
0.00% |
| State13 | State13 |
1,096 |
0.00% |
| State14 | State14 |
1,059 |
0.00% |
| State21 | State21 |
1,012 |
0.00% |
| State20 | State20 |
981 |
0.00% |
| State5 | State5 |
845 |
0.00% |
| State12 | State12 |
800 |
0.00% |
| State10 | State10 |
763 |
0.00% |
| State11 | State11 |
739 |
0.00% |
| State19 | State19 |
726 |
0.00% |
| State8 | State8 |
670 |
0.00% |
| State9 | State9 |
614 |
0.00% |
| State17 | State17 |
613 |
0.00% |
| State22 | State22 |
588 |
0.00% |
| State6 | State6 |
514 |
0.00% |
| State26 | State26 |
11 |
0.00% |
 |
Map Key
| Turnout
 |  |
|


